Can StatLite monitor a Pyronaut Python app?
A focused compatibility check: can a Pyronaut application use StatLite's existing Micronaut collector without Pyronaut-specific StatLite code?
Question
Can a Python app built with Pyronaut expose the Micronaut and Micrometer Prometheus metrics that StatLite already understands?
Setup
| Component | Version |
|---|---|
| Pyronaut CLI | 0.1.0 |
| Micronaut Core / Platform | 5.2.14 / 5.2.1 |
| Micronaut Micrometer / Micrometer | 6.1.0 / 1.17.1 |
| GraalPy | 25.4.4.1.1, Python 3.13.14 |
| GraalVM CE / JDK | 25.4.4.1.1 / 25.0.4.1.1 |
| StatLite | 0.6.0, released |
The app was a one-route HTTP service, run in Docker on Ubuntu 24.04.4 x86_64. It explicitly enabled Micronaut management, Micrometer, and the Prometheus registry, and configured `/prometheus` and `/health`.
Test
- Start the small Pyronaut app;
/helloreturnsHello from Pyronaut. - Request
/helloseveral times and make a 404 request so request metrics are materialized. - Inspect
/prometheusand/health. - Poll
/prometheuswith released StatLite using the ordinary Micronaut target every five seconds.
targets:
  - name: pyronaut-demo
    type: micronaut
    url: http://127.0.0.1:18088/prometheus
Result
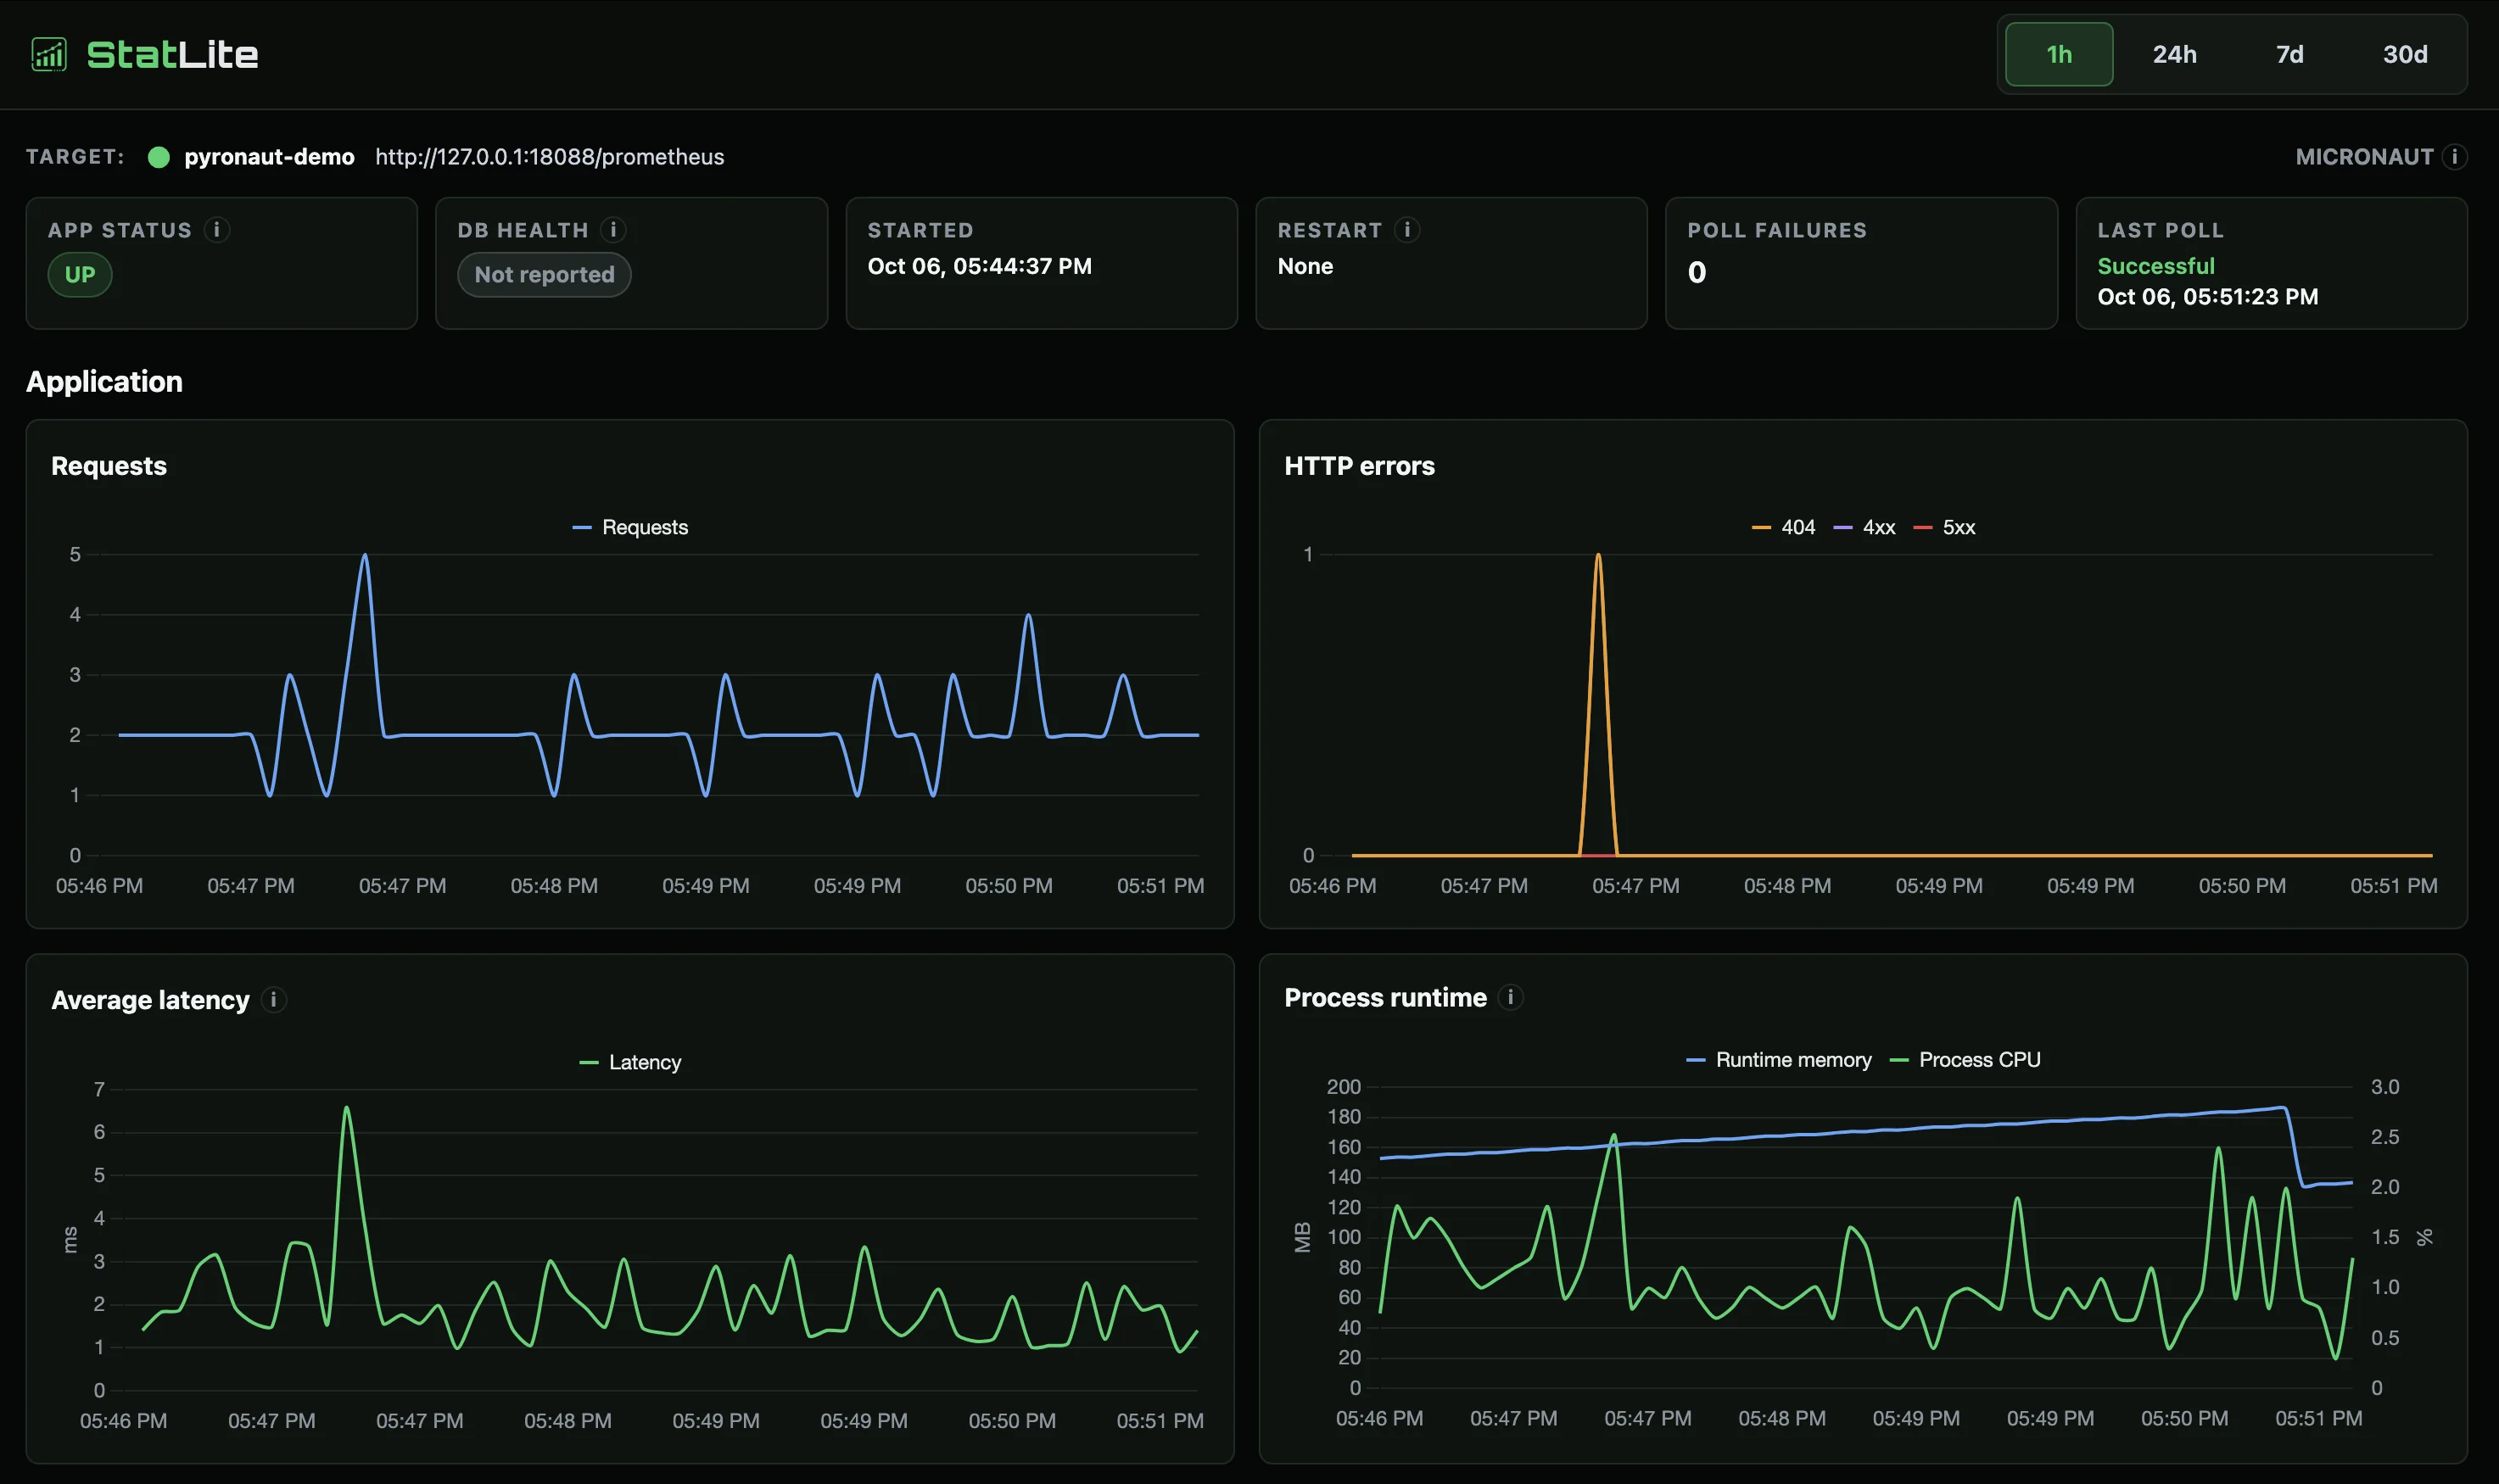
PASS. StatLite 0.6.0 detected Micronaut Metrics, reported the target compatible, and collected 15 successful polls over about 68 seconds. Application health was UP, with no collection failures. All nine supported normalized signals were available:
http_requests_totalhttp_404_totalhttp_4xx_totalhttp_5xx_totalhttp_request_time_total_secondsprocess_cpu_usagejvm_heap_used_bytesprocess_start_timeprocess_uptime
HTTP count and duration changed after traffic. The raw HTTP timer was a Micrometer summary with the expected `_count` and `_sum` series and method, status, URI, and exception labels.
Why it works
With Micronaut management and Micrometer Prometheus enabled, the Pyronaut app exposes the ordinary Prometheus series StatLite's existing Micronaut target already collects, so no StatLite changes were required.
Caveat
This demonstrates Pyronaut compatibility, not generic Python framework support. It says nothing about FastAPI, Django, Flask, or other Python applications. JVM CPU, heap, start-time, and uptime metrics describe the underlying JVM/GraalPy process. The heap metric is not a separate Python interpreter heap measurement.
Sources
Experiment record Pyronaut documentation Micronaut Micrometer guide StatLite Micronaut target