Your orders API runs on a small VPS. Health checks are green, logs show 200 OK, and yet users say it feels sluggish. By the time you SSH in and run top, everything looks normal.
Uptime checks tell you the API is available. Application logs show its requests, but rarely show what else ran on the machine. top shows the machine now, not ten minutes ago. To investigate a short slowdown, you need application and host metrics on the same timeline with some history.
StatLite runs next to the app, reads Spring Boot Actuator metrics, and keeps the history in a local SQLite file. It can also show host metrics. Here's how those views help explore a slowdown.
This example uses Spring Boot. StatLite also supports Quarkus and applications that expose the StatLite Metrics v1 endpoint; see the integrations.
The scenario
- A small VPS with one CPU
- A Spring Boot orders API backed by a database, receiving steady traffic
- StatLite running on the same machine
- A CPU-heavy maintenance job that starts partway through, runs for about 90 seconds, then exits
The API's code, configuration, and request pace stay the same throughout this hypothetical example.
Step 1: When did it get slow?
Open the dashboard and look at Average latency, which shows how long requests take on average between polls.
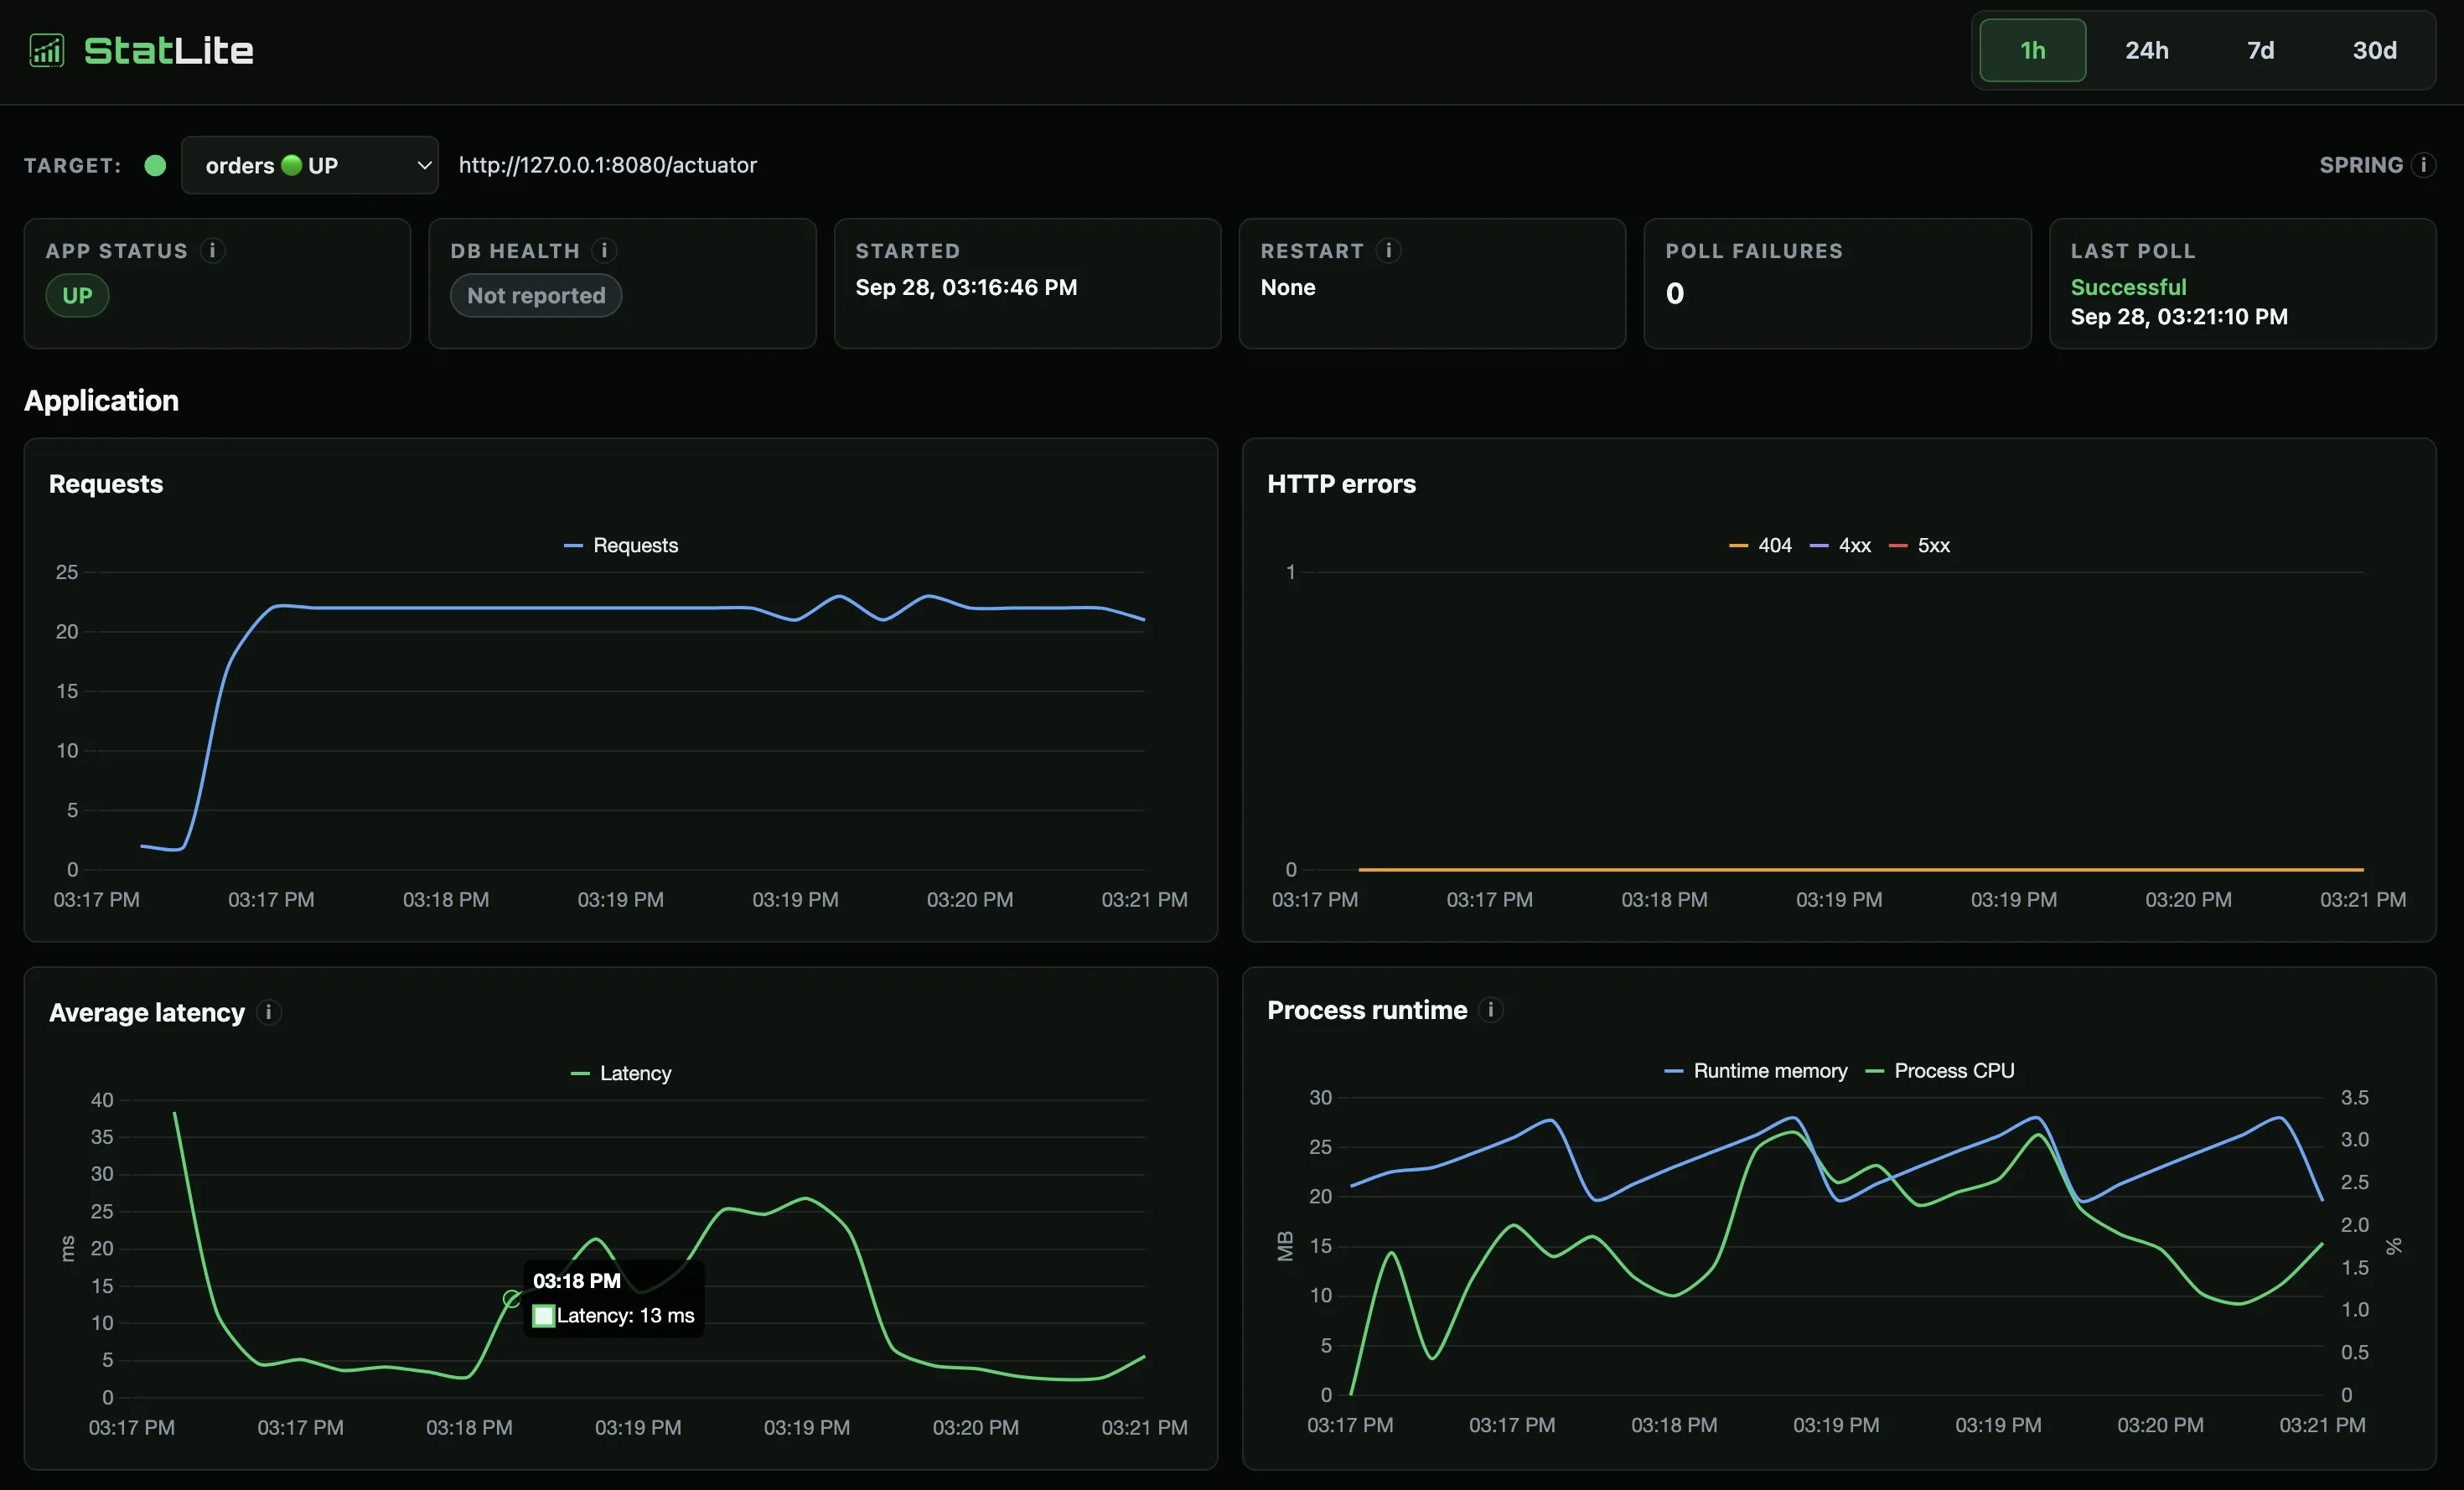
After startup settles, requests take about 3 to 5 ms. At about 3:18 PM, average latency climbs to around 25 ms, then drops back at about 3:20 PM. That gives you a time window to compare with the other charts.
Step 2: Is it more traffic, or errors?
On the same screen, Requests stay flat, HTTP errors stay at zero, and App status stays UP. An uptime monitor would report the service as healthy through this period.
Step 3: Is the app doing more work?
Process runtime on the dashboard shows the API's own JVM. Its CPU remains under about 3% in the displayed period, while its memory follows the same pattern before, during, and after the pressure window.
The app does not appear to be using more CPU. That makes an application CPU regression less likely, though the chart alone cannot rule out database, disk, or network waits.
Step 4: Is something else busy on the server?
Spring Boot does not provide this host view by default. StatLite can show host data when an application exposes it. It also comes with a self-monitoring target that collects metrics from the machine running StatLite. In this example, that target gives us a second dashboard. Switch to statlite-self and look at Host resources.
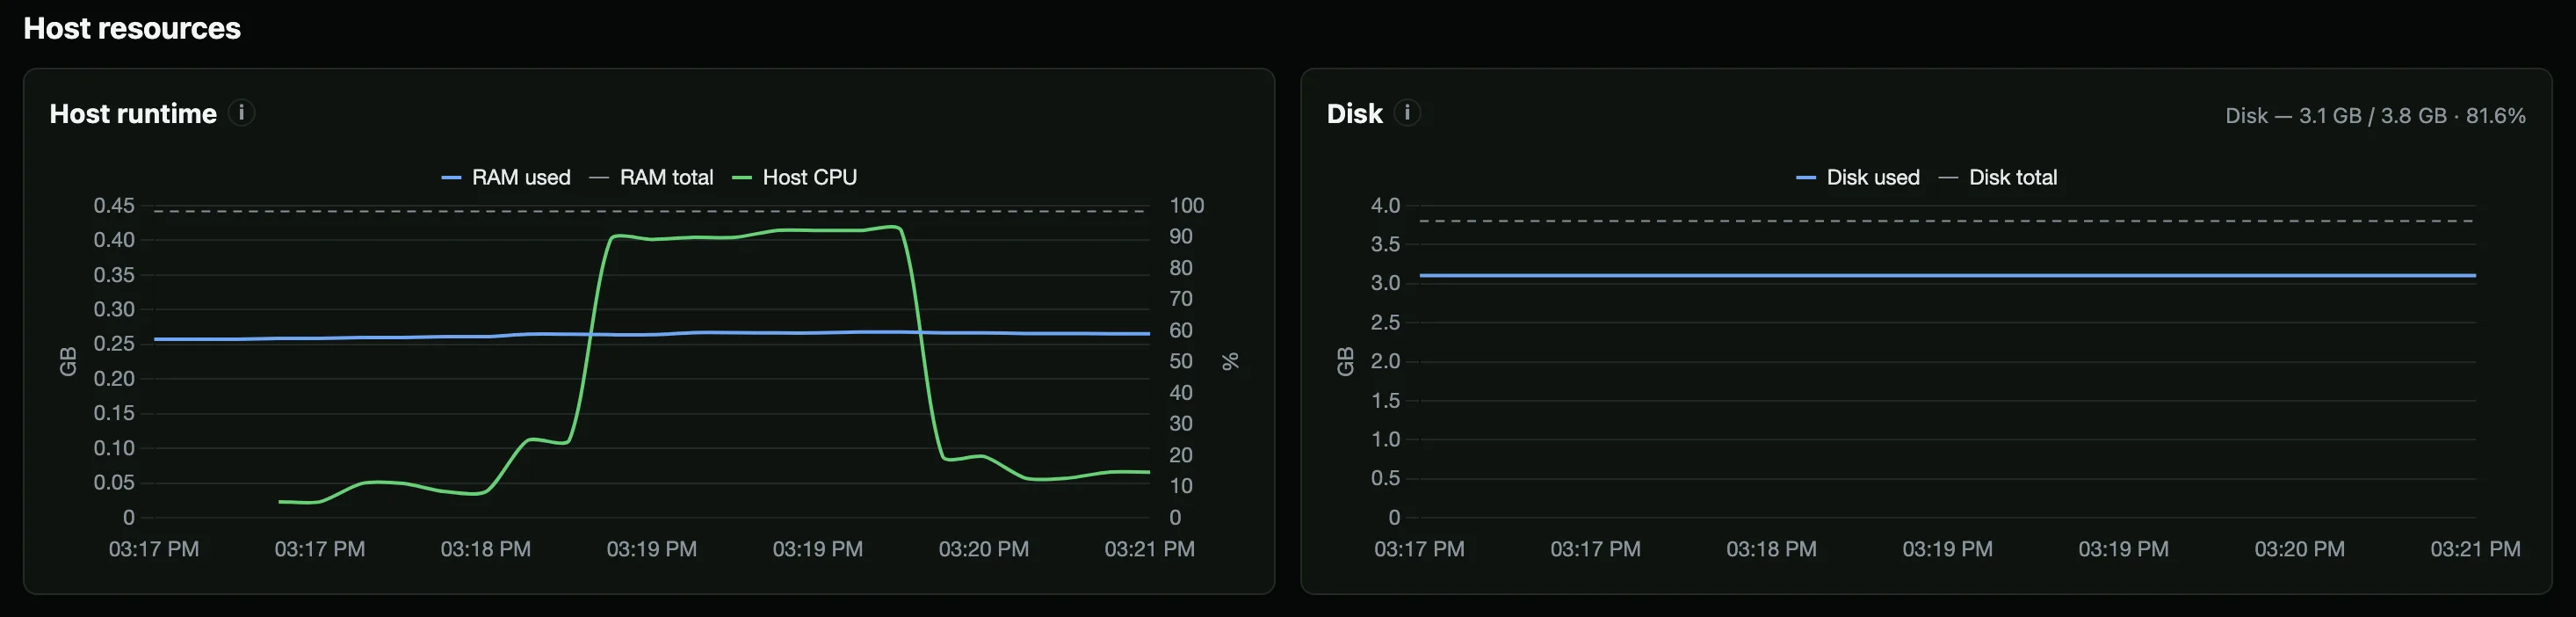
Host CPU rises from roughly 10% to about 90% at 3:18 PM, then falls just before 3:20 PM. RAM and disk stay roughly flat.
The app's CPU stays low while the host's CPU is busy. On a single CPU, another process can make the API wait for CPU time. This pattern points toward CPU contention. Here, the competing process is the maintenance job. On a real server, the dashboards narrow the search to other processes during that time window.
Finding the culprit
The host chart tells us when the CPU was busy, but it does not name the process. Looking at what else ran during those minutes, we find a scheduled maintenance job. That fits the timing: it starts as latency rises and ends as latency returns to normal.
On another server, the cause could be a different job or process. The useful part is the narrower question: what was using the host CPU during the slow window?
Other patterns to notice
| What you see | Where to look next |
|---|---|
| Requests up, app CPU up | Traffic volume and application capacity |
| Requests flat, app CPU up | Application work, including a recent deploy |
| Requests flat, app CPU flat, host CPU up | Other processes on the host |
| App memory keeps climbing | Memory pressure, application allocation, and possible memory leaks |
| Everything flat except latency | Dependencies, database, disk, and network waits |
These are clues for investigation, not diagnoses by themselves. StatLite keeps the application and host history together so you can inspect the relevant minutes after the slowdown is over.
See application and host metrics on one timeline. Set up StatLite on your server, or explore the sample dashboard first.
For questions about this article or StatLite, visit the StatLite discussions.