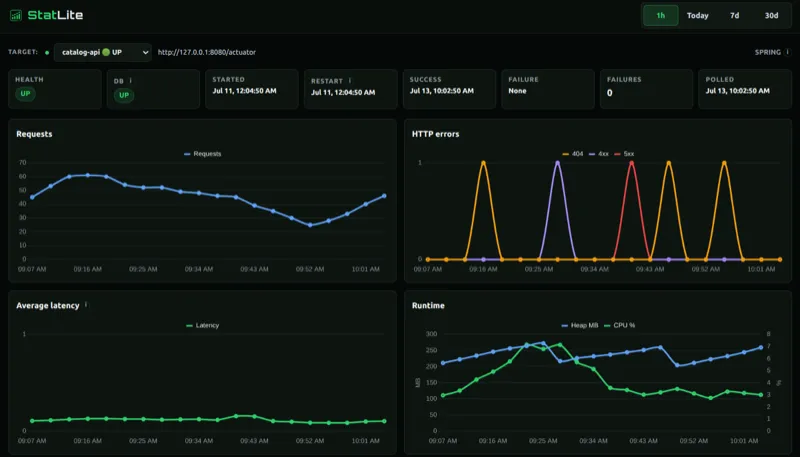
Spring Boot Actuator
Health, traffic, latency, CPU, memory, and restarts in one focused dashboard.
Turn Spring Boot Actuator into a self-hosted dashboard with history, charts, restart detection, and local SQLite storage. Quarkus and other applications can use the same dashboard.
One Go binary. About 15 MiB idle. No external monitoring services.
Open http://127.0.0.1:9090. StatLite monitors itself out of the box, so you can explore the dashboard before configuring your application.
docker run --rm \
  -p 127.0.0.1:9090:9090 \
ghcr.io/pvrlabs/statlite:latestInstall the latest release on macOS or Linux with the command that fits your workflow.
curl -fsSL https://raw.githubusercontent.com/PVRLabs/statlite/main/install.sh | sh
Installs to ~/.local/bin. Add it to your PATH if it is not already included.
Designed for private or protected networks. Built-in authentication is not included.
Health, traffic, latency, CPU, memory, and restarts in one focused dashboard.
About 15 MiB idle in current measurements, with one Go binary and one local SQLite database.
Self-hosted history with no external monitoring service required.
CPU, memory, and filesystem capacity through self-monitoring or applications that expose them.
Actuator already exposes useful metrics. StatLite adds focused history and charts without asking you to deploy a full Prometheus and Grafana stack. Quarkus is supported too; see the side-by-side 512 MB run.
Health and metrics endpoints for Spring Boot applications.
Micrometer Prometheus/OpenMetrics metrics, with optional SmallRye Health.
A fixed JSON profile for lightweight application integrations, with guides for FastAPI, Express, and Django. The Express article shows how to expose /statlite/metrics, and Configure StatLite generates the matching target configuration.
StatLite monitors its own host and SQLite filesystem capacity.
targets:
  - name: "my-app"
    type: "spring"
url: "http://localhost:8080/actuator"StatLite is a good fit for one or a few applications, small VPS deployments, solo developers and small teams, and focused application and host metrics.
Useful for keeping small services observable? A GitHub star helps more developers find StatLite.
Star StatLite