With batching, Scriptella imported a million typed CSV rows in about 15 seconds on PostgreSQL and about 10 seconds on MariaDB. Handwritten JDBC was faster by about a second on PostgreSQL and about three seconds on MariaDB. For an ETL job that runs occasionally, those seconds may be worth a declarative workflow instead of custom Java import code.
Those are medians of two local runs. On PostgreSQL the batched observations overlap, so the one-second gap is not stable. On MariaDB the runs stay apart. I maintain Scriptella, the Java ETL tool. The code and measurements are public.
The job was a million-row CSV into a typed table that already exists: an integer id, two strings, an exact decimal, and a timestamp. PostgreSQL stores that timestamp as TIMESTAMP WITHOUT TIME ZONE; MariaDB uses DATETIME. Clients and sessions use UTC. There are no nulls, transformations, or indexes.
csvsql took roughly nine to ten minutes. COPY finished in under two seconds. csvsql builds a table in memory first. COPY loads a file that already matches a PostgreSQL table.
Local results
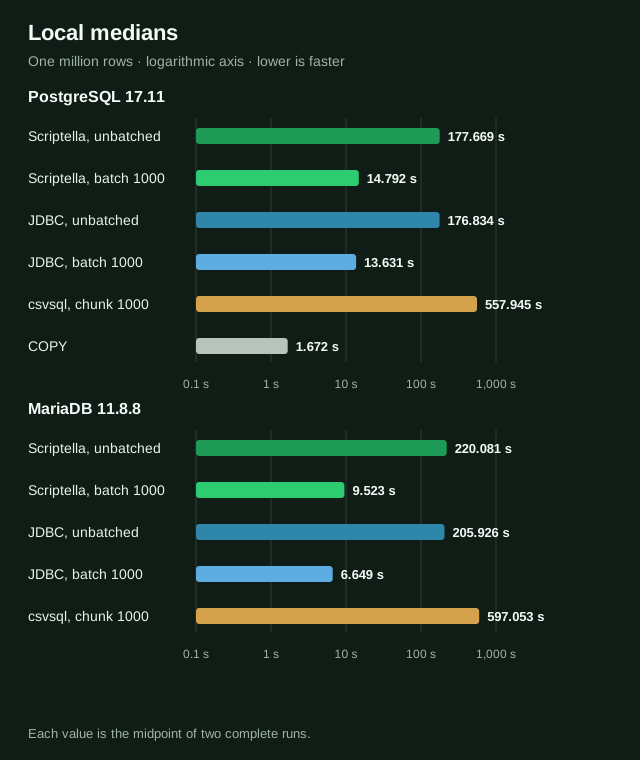
Each duration is the midpoint of two complete runs. All times are seconds; lower is faster. The slow Java bars and the fast Java bars use one commit for the whole file. The difference is batching, not a commit per row.
| Import path | PostgreSQL 17.11 | MariaDB 11.8.8 |
|---|---|---|
| Scriptella, unbatched | 177.669 | 220.081 |
| Scriptella, batch 1000 | 14.792 | 9.523 |
| JDBC, unbatched | 176.834 | 205.926 |
| JDBC, batch 1000 | 13.631 | 6.649 |
| csvsql, chunk 1000 | 557.945 | 597.053 |
| PostgreSQL COPY, native reference | 1.672 | Not available |
The host was a Mac with 32 GiB RAM, x86_64 Colima with four CPUs and 6 GiB, Temurin 17.0.17, and csvsql 2.2.0 on Python 3.12.3. The full local report has the individual measurements.
Batching was the large change. Scriptella's median fell from 177.7 to 14.8 seconds on PostgreSQL and from 220.1 to 9.5 seconds on MariaDB, about 12× and 23×. Every case used one transaction and one commit, including the unbatched cases. JDBC called executeUpdate() per row when unbatched, and addBatch() with executeBatch() every 1,000 rows when batched. Scriptella set statement.batchSize=1000. Driver defaults stayed in place: pgJDBC reWriteBatchedInserts=false, and MariaDB Connector/J useBulkStmts=false with useBulkStmtsForInserts=true.
The remaining gap
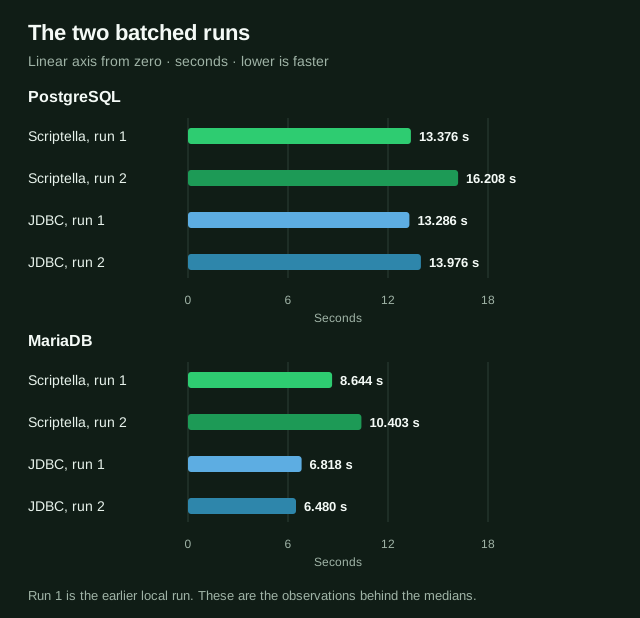
After batching, JDBC's median was about 1.16 seconds lower on PostgreSQL and 2.87 seconds lower on MariaDB. Two runs are too few to treat that gap as stable. On PostgreSQL the observations overlap: Scriptella took 13.376 and 16.208 seconds, JDBC 13.286 and 13.976. On MariaDB they separate: Scriptella 8.644 and 10.403, JDBC 6.818 and 6.480. The paths use different CSV parsers, and the clock includes process startup.
The insert
The query is the part that matches the batched insert. The connection and the CSV formats sit above it. driver="postgresql" is Scriptella's built-in adapter and still needs the JDBC driver. MariaDB uses driver="mariadb". The published runs also set autocommit=false and statement.batchSize=1000. Commas, double quotes, and a header are CSV defaults.
Scriptella query
<query connection-id="csv">
  <script connection-id="db">
    INSERT INTO csv_import (id,name,category,amount,created_at)
    VALUES (?id, ?name, ?category, ?amount, ?created_at);
  </script>
</query>
JDBC batch
for (var row : csv) {
    insert.setLong(1, Long.parseLong(row.get("id")));
    insert.setString(2, row.get("name"));
    insert.setString(3, row.get("category"));
    insert.setBigDecimal(4, new BigDecimal(row.get("amount")));
    insert.setTimestamp(5, Timestamp.valueOf(
            java.time.LocalDateTime.parse(row.get("created_at"), Benchmark.CSV_TIME)), utc);
    insert.addBatch();
    if (++pending == 1000) {
        insert.executeBatch();
        insert.clearBatch();
        pending = 0;
    }
}
if (pending > 0) {
    insert.executeBatch();
}
connection.commit();
The full ETL file and the importer source have the connection settings used for measurement.
For an occasional job, that query is what the seconds buy. Keeping it is a maintenance judgment, not a measured cost inside Scriptella.
csvsql
csvsql --db '<SQLAlchemy URL>' \
  --tables csv_import --no-create \
  --insert --chunk-size 1000 fixture.csv
csvsql 2.2.0 reads the CSV into an agate table, then inserts through SQLAlchemy. Chunking the inserts does not make that table streaming. Building it is a fair cost for an unknown file. Here the table already existed. The median ratios versus batched Scriptella were 37.7× on PostgreSQL and 62.7× on MariaDB. Those describe these workflows, not a Python-versus-Java ranking.
Process memory
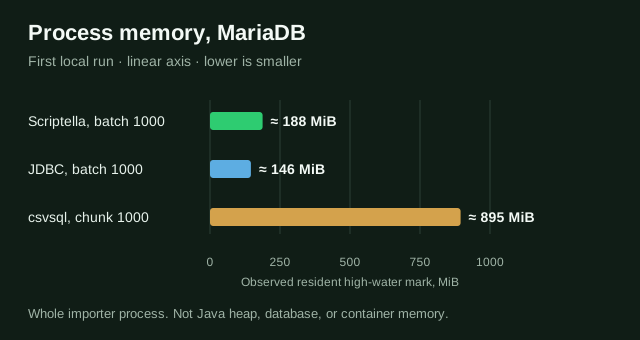
On the first local MariaDB run, approximate process high-water marks were 188 MiB for batched Scriptella, 146 MiB for batched JDBC, and 895 MiB for csvsql. Sampling was once a second, the second run had no sampler, and these are whole processes, not heap or database memory. The collection notes have the limits.
PostgreSQL COPY
COPY was the fastest measured path: 1.672 seconds locally, and 0.968 seconds on the CI run below. It streamed this file through pgJDBC, unchanged, into a matching table. There is no MariaDB number, and a MariaDB native loader was not timed. A filter or a transformation can use COPY FROM ... WHERE, a BEFORE INSERT trigger, a staging table, or application-side changes. None of those were measured.
GitHub Actions
I ran the same experiment once on a GitHub Actions Ubuntu 24.04 x86_64 runner. Times are seconds.
| Import path | PostgreSQL | MariaDB |
|---|---|---|
| Scriptella, batch 1000 | 6.858 | 4.446 |
| JDBC, batch 1000 | 5.854 | 2.998 |
| csvsql, chunk 1000 | 221.805 | 214.924 |
| PostgreSQL COPY, native reference | 0.968 | Not available |
Same ordering, different times. The 0.968-second COPY row is the same direct load. It was not measured on MariaDB, and it does not cover a filter or a transformation. This run stays separate from the local results. Hosted runners vary, and CI memory was not measured.
What the clock includes
Timings cover a fresh process from start through exit. They leave out container startup, fixture generation, table reset, verification, and an untimed 20,000-row warmup. That warmup does not warm the measured JVM. A 2,001-row prefix runs first and exercises a partial batch. After each import, a separate connection checks the row count and the first, middle, and last values. That check is not every cell.
The benchmark repository has the Docker Compose command and the published measurements. Keep the environment and the individual runs if you reproduce it.
Benchmark repository Local report CI results Importer source