A small Express application still needs a few operational answers: how much traffic is arriving, whether 4xx or 5xx responses are rising, whether requests are slowing down, and how much CPU and heap the Node.js process is using. Prometheus and Grafana can answer those questions. For one application on a VPS, they can also be more infrastructure than the application warrants.
In this article, we show you how to add lightweight metrics to an Express application and visualize them in StatLite. A small helper exposes the application's request, error, latency, CPU, heap, and uptime data to StatLite, which stores the history and presents it in one dashboard. The integration uses StatLite's statlite-metrics profile and does not require a Prometheus client or Grafana.
FastAPI, Django, Gin, and Go net/http use that same endpoint and the same StatLite target, each with its own helper. Spring Boot keeps a first-party Actuator integration, described in Lightweight Spring Boot Monitoring Without Prometheus and Grafana.
The helper below matches the Express integration guide. That guide is the source of truth if the two ever differ.
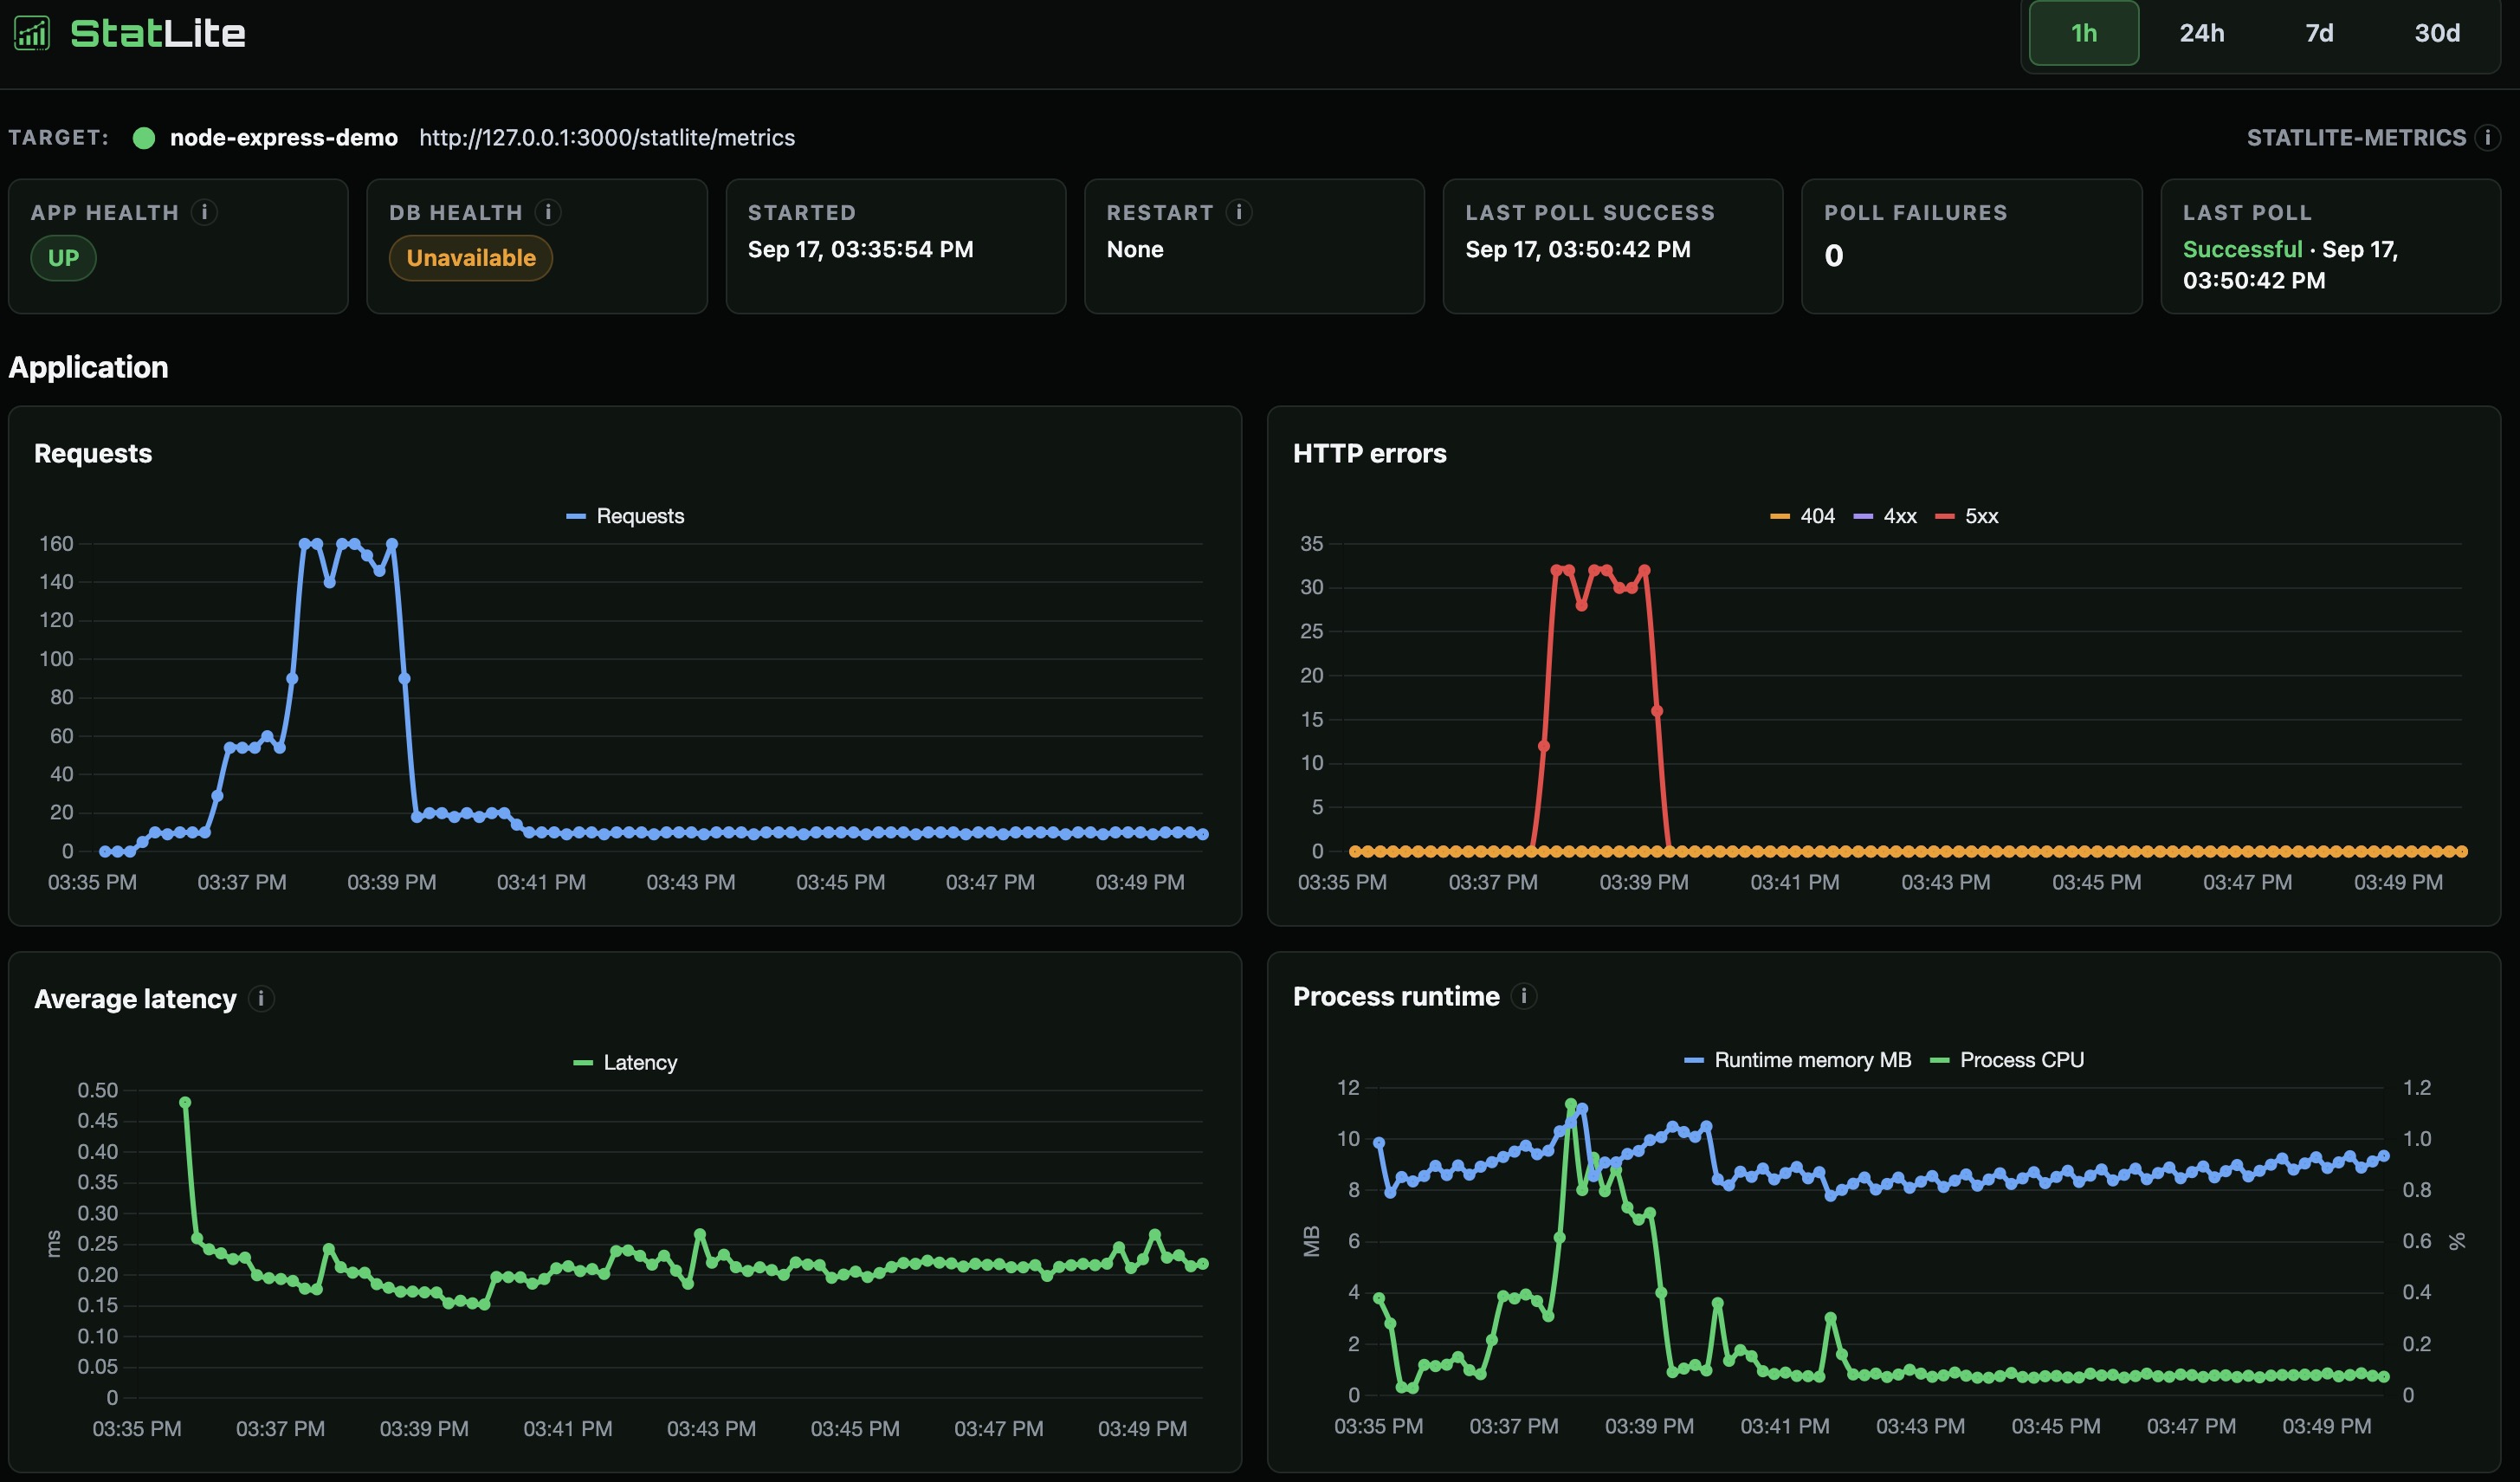
/statlite/metrics. Database health stays unavailable because this helper has no database signal to report.One JSON endpoint. One StatLite process. No Prometheus client in the application.
What the helper is for
StatLite cannot see request counts, HTTP errors, or latency from outside the process. The helper records them where Express already sees every response. It is ordinary application code: no npm metrics package, no exporter, and no sidecar.
The example was exercised with Node.js 24.21.0 LTS and Express 5.1.0. It uses stable process APIs and the standard middleware and response APIs. That is the tested baseline, not a promise about every Express release.
Counters live in the Node.js process. This article is for one process. Cluster mode, PM2 clusters, and several replicas each need their own counters and their own start time. That boundary is covered later, because a load balancer in front of those workers will make the charts lie.
Quick start for an existing app
If you already have an Express application, the integration has four pieces:
- Save the helper below as
statlite-metrics.js. - Register its middleware before your routes and its metrics endpoint alongside your routes.
- Keep
/statlite/metricsreachable by StatLite, but private from the public internet. - Add a
statlite-metricstarget pointing to that endpoint.
The runnable demo later in this article includes sample routes and a local app.listen call. Copy the helper and integration wiring into an existing app, but keep your app's own routes, startup code, and deployment bind address.
Paste the helper into the application
Save this as statlite-metrics.js next to the application file:
// Source and updates: https://github.com/PVRLabs/statlite/blob/main/docs/integrate/node/express.md

const { performance } = require("node:perf_hooks");

const METRICS_PATH = "/statlite/metrics";
const startedAt = new Date(Date.now() - process.uptime() * 1000);

const counters = {
  requestsTotal: 0,
  responses404Total: 0,
  responses4xxTotal: 0,
  responses5xxTotal: 0,
  requestDurationSecondsTotal: 0,
};

let previousCpu = process.cpuUsage();
let previousCpuTime = performance.now();

function record(statusCode, durationSeconds) {
  counters.requestsTotal += 1;
  counters.requestDurationSecondsTotal += durationSeconds;
  if (statusCode === 404) counters.responses404Total += 1;
  if (statusCode >= 400 && statusCode < 500) counters.responses4xxTotal += 1;
  if (statusCode >= 500 && statusCode < 600) counters.responses5xxTotal += 1;
}

function statliteMetricsMiddleware(req, res, next) {
  if (req.path === METRICS_PATH) return next();

  const requestStarted = performance.now();
  res.once("finish", () => {
    record(res.statusCode, (performance.now() - requestStarted) / 1000);
  });
  next();
}

function snapshot() {
  const now = performance.now();
  const cpu = process.cpuUsage();
  const elapsedSeconds = (now - previousCpuTime) / 1000;
  const cpuSeconds =
    (cpu.user - previousCpu.user + cpu.system - previousCpu.system) / 1e6;
  const processCpuUsage = elapsedSeconds > 0 ? cpuSeconds / elapsedSeconds : 0;
  previousCpu = cpu;
  previousCpuTime = now;

  return {
    schema: "statlite-metrics/v1",
    integration: "express",
    status: "UP",
    started_at: startedAt.toISOString(),
    metrics: {
      requests_total: counters.requestsTotal,
      responses_404_total: counters.responses404Total,
      responses_4xx_total: counters.responses4xxTotal,
      responses_5xx_total: counters.responses5xxTotal,
      request_duration_seconds_total: counters.requestDurationSecondsTotal,
      process_cpu_usage: processCpuUsage,
      runtime_heap_used_bytes: process.memoryUsage().heapUsed,
      uptime_seconds: process.uptime(),
    },
  };
}

function statliteMetricsEndpoint(req, res) {
  res.json(snapshot());
}

module.exports = {
  METRICS_PATH,
  statliteMetricsEndpoint,
  statliteMetricsMiddleware,
};
Register the middleware before the routes, and keep the error handler after them. The finish listener then sees the final status, including a 500 chosen by later error-handling middleware.
const express = require("express");
const {
  METRICS_PATH,
  statliteMetricsEndpoint,
  statliteMetricsMiddleware,
} = require("./statlite-metrics");

const app = express();

app.use(statliteMetricsMiddleware);
app.get(METRICS_PATH, statliteMetricsEndpoint);

app.get("/", (req, res) => res.json({ message: "hello" }));
app.get("/failure", (req, res, next) => next(new Error("example failure")));

app.use((err, req, res, next) => {
  console.error(err);
  if (res.headersSent) return next(err);
  res.status(500).json({ error: "internal server error" });
});

app.listen(3000, "127.0.0.1");
The middleware skips /statlite/metrics, including requests that carry a query string, so StatLite's own polls do not inflate traffic or latency. A 404 increments both the 404 counter and the 4xx counter, because a 404 is a subset of 4xx. Connections that close before a response finishes are not counted.
The sample binds Express to 127.0.0.1 for a local demo. In a container or deployment where a reverse proxy reaches Express over the network, bind to the interface your deployment requires, often 0.0.0.0, and keep the metrics endpoint private with network or proxy access controls.
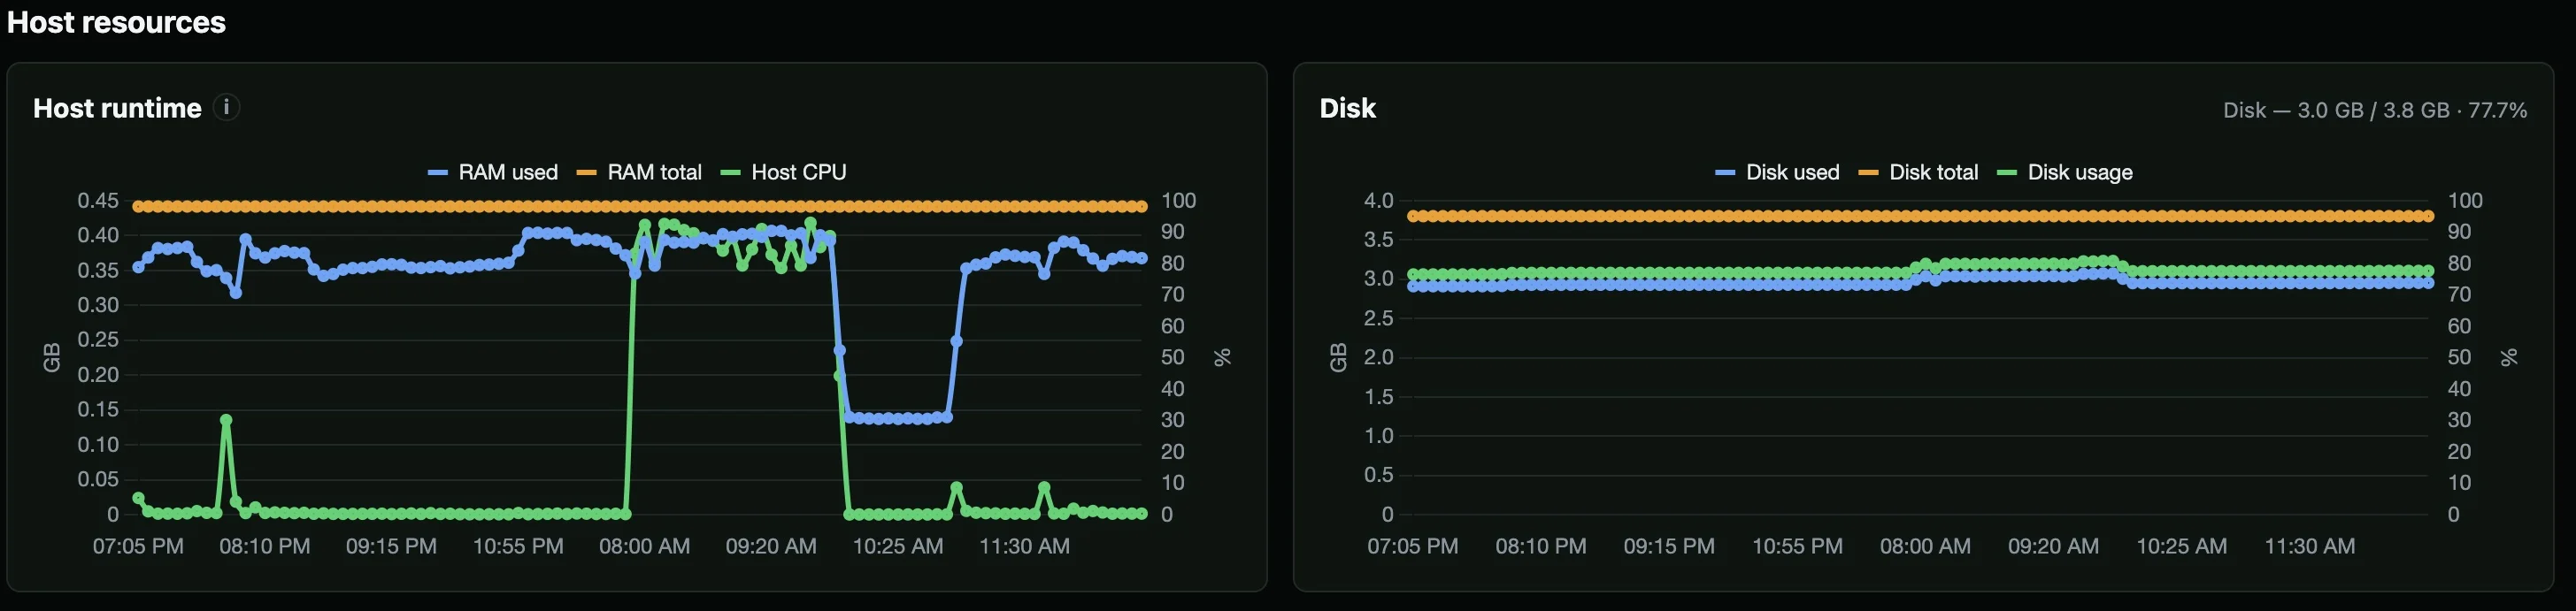
runtime_heap_used_bytes is V8 heap, not process RSS, container memory, or a heap limit. process_cpu_usage is CPU seconds divided by wall seconds since the previous snapshot, in cores. Host CPU, memory, and disk are omitted. StatLite can show those from its self-monitoring target when it runs on the same machine.
The endpoint StatLite polls
GET /statlite/metrics returns one JSON snapshot and a successful 2xx response. A response can look like this:
{
  "schema": "statlite-metrics/v1",
  "integration": "express",
  "status": "UP",
  "started_at": "2026-09-17T20:00:00Z",
  "metrics": {
    "requests_total": 1420,
    "responses_404_total": 18,
    "responses_4xx_total": 31,
    "responses_5xx_total": 4,
    "request_duration_seconds_total": 84.31,
    "process_cpu_usage": 0.031,
    "runtime_heap_used_bytes": 25165824,
    "uptime_seconds": 1820
  }
}
Only schema and a non-empty status are required. integration, started_at, and each metric are optional. started_at is worth sending when the process can name its start time, because StatLite uses it, together with counter resets, to notice a new run.
status: "UP" in this helper is the application's own statement at snapshot time. It does not mean every dependency is healthy. The helper leaves out database_status on purpose. Add that field only from a signal the application already trusts, or from a cached check. Do not query a database on every StatLite poll, and do not invent a value when no signal exists.
Field semantics, including which counters are cumulative, live in the StatLite Metrics v1 specification. The profile has no labels, histogram buckets, or arbitrary metric names. Average latency on the dashboard is derived by StatLite from the change in cumulative duration and request count between polls. The application keeps the running totals.
Point StatLite at the endpoint
Install the StatLite binary with the installation guide, or follow the same install step in the Spring Boot article. The process, the SQLite file, and the dashboard are the same. The target type is what changes.
The runnable Express demo ships this configuration:
server:
  listen: "127.0.0.1:9090"

storage:
  sqlite_path: "./statlite-express-demo.sqlite"

polling:
  interval: "10s"
  timeout: "5s"

targets:
  - name: "node-express-demo"
    type: "statlite-metrics"
    url: "http://127.0.0.1:3000/statlite/metrics"
A relative sqlite_path is resolved from the directory that contains the config file. listen keeps the dashboard on loopback. Ten seconds is for a local demo. Use 30 seconds or longer in production. The YAML tells StatLite where to poll. It does not install the middleware.
For a normal deployment the target block is the part that matters. Server, storage, and polling options are documented in the configuration reference.
Run it and check the numbers
From a clone of the repository:
cd statlite/examples/node-express-demo
npm install
npm start
The demo requires Node.js 24.21.0 LTS and an installed statlite binary. If you are using a source checkout instead, the source-based command appears below.
Express listens on http://127.0.0.1:3000. In another terminal, send one success, one miss, and one failure, then read the snapshot:
curl -s http://127.0.0.1:3000/
curl -s -o /dev/null -w '%{http_code}\n' http://127.0.0.1:3000/missing
curl -s -o /dev/null -w '%{http_code}\n' http://127.0.0.1:3000/failure
curl -s http://127.0.0.1:3000/statlite/metrics
The snapshot should show three completed application requests, one 404 counted in both the 404 and 4xx fields, and one 5xx. Use statlite inspect to validate the endpoint and profile, then use statlite --config statlite.yaml to start the dashboard. If the binary is not on your PATH, replace statlite with its installed path:
statlite inspect 'http://127.0.0.1:3000/statlite/metrics'
statlite --config statlite.yaml
Open http://127.0.0.1:9090. To make the charts move, generate a burst and then some failures:
for i in {1..50}; do curl -s http://127.0.0.1:3000/ > /dev/null; done
for i in {1..10}; do curl -s http://127.0.0.1:3000/failure > /dev/null; done
Wait for the next poll. Request volume and 5xx activity should step up together. StatLite treats the counters as resettable process signals: it does not draw negative deltas, and it does not carry a delta across a detected restart. A restart shows up on a later successful poll, so the dashboard can lag the process by about one interval.
If you are running StatLite from a source checkout instead of an installed binary, start it from the repository root:
go run ./cmd/statlite --config examples/node-express-demo/statlite.yamlThe same pattern in other frameworks
Each guide below is a copyable helper for one framework. All of them use type: statlite-metrics and GET /statlite/metrics. None of them is a new target type.
| Framework | Guide | Runnable demo |
|---|---|---|
| Express | Express guide | Express demo |
| FastAPI | FastAPI guide | FastAPI demo |
| Django | Django guide | Django demo |
Go net/http | net/http guide | net/http demo |
| Gin | Gin guide | Gin demo |
The integration principles are the shared rules: report only what the application can actually observe, keep the helper small, and leave unsupported cases out of the metrics instead of inventing a number. The integration index is the list to check when a framework is missing here.
A general Prometheus client inside Express would still need an adapter. StatLite does not ingest arbitrary Prometheus or OpenMetrics text on this target. Spring Boot and Quarkus are the first-party path, because those frameworks already publish a stable metrics contract. The Spring Boot article uses that Actuator target directly.
Boundaries that matter in production
One process, one target
The helper keeps counters in one Node.js process. For multi-process deployments, use stable per-process targets or application-owned aggregation; otherwise load-balanced polling can produce misleading rates or apparent restarts.
See Monitoring Options for the multi-process tradeoff and the aggregation approach under consideration.
Keep the snapshot cheap
/statlite/metrics should return numbers the process already has. Snapshot collection in this helper does no database or network I/O. If a reverse proxy mounts the application under a prefix, the configured URL still has to reach the same /statlite/metrics path the middleware excludes.
Keep the dashboard and endpoint private
StatLite is designed for a private or protected monitoring path. Keep the dashboard on loopback or behind a VPN, SSH tunnel, firewall, or authenticated reverse proxy, and keep /statlite/metrics reachable by StatLite without requiring the target to present credentials. See Monitoring Options for deployment and authentication details.
Run the example
The tested application, helper, tests, and config are in examples/node-express-demo. npm test in that directory checks normal, 404, and 500 responses, and checks that polling /statlite/metrics does not increment application counters.
Monitor an Express application with one pasted helper and a local StatLite dashboard.