You have a FastAPI application that you want to run on a small VPS. Once real traffic arrives, you want practical answers: how much traffic is coming in, which HTTP errors appear, whether latency is changing, and whether the process or server is under pressure.
You do not need a VPS to try the setup in this article. I ran the example locally, where FastAPI exposes one small metrics endpoint and StatLite stores the resulting history in SQLite. The same simple setup can run alongside a small FastAPI deployment on a VPS without adding Prometheus, Grafana, or another monitoring database.
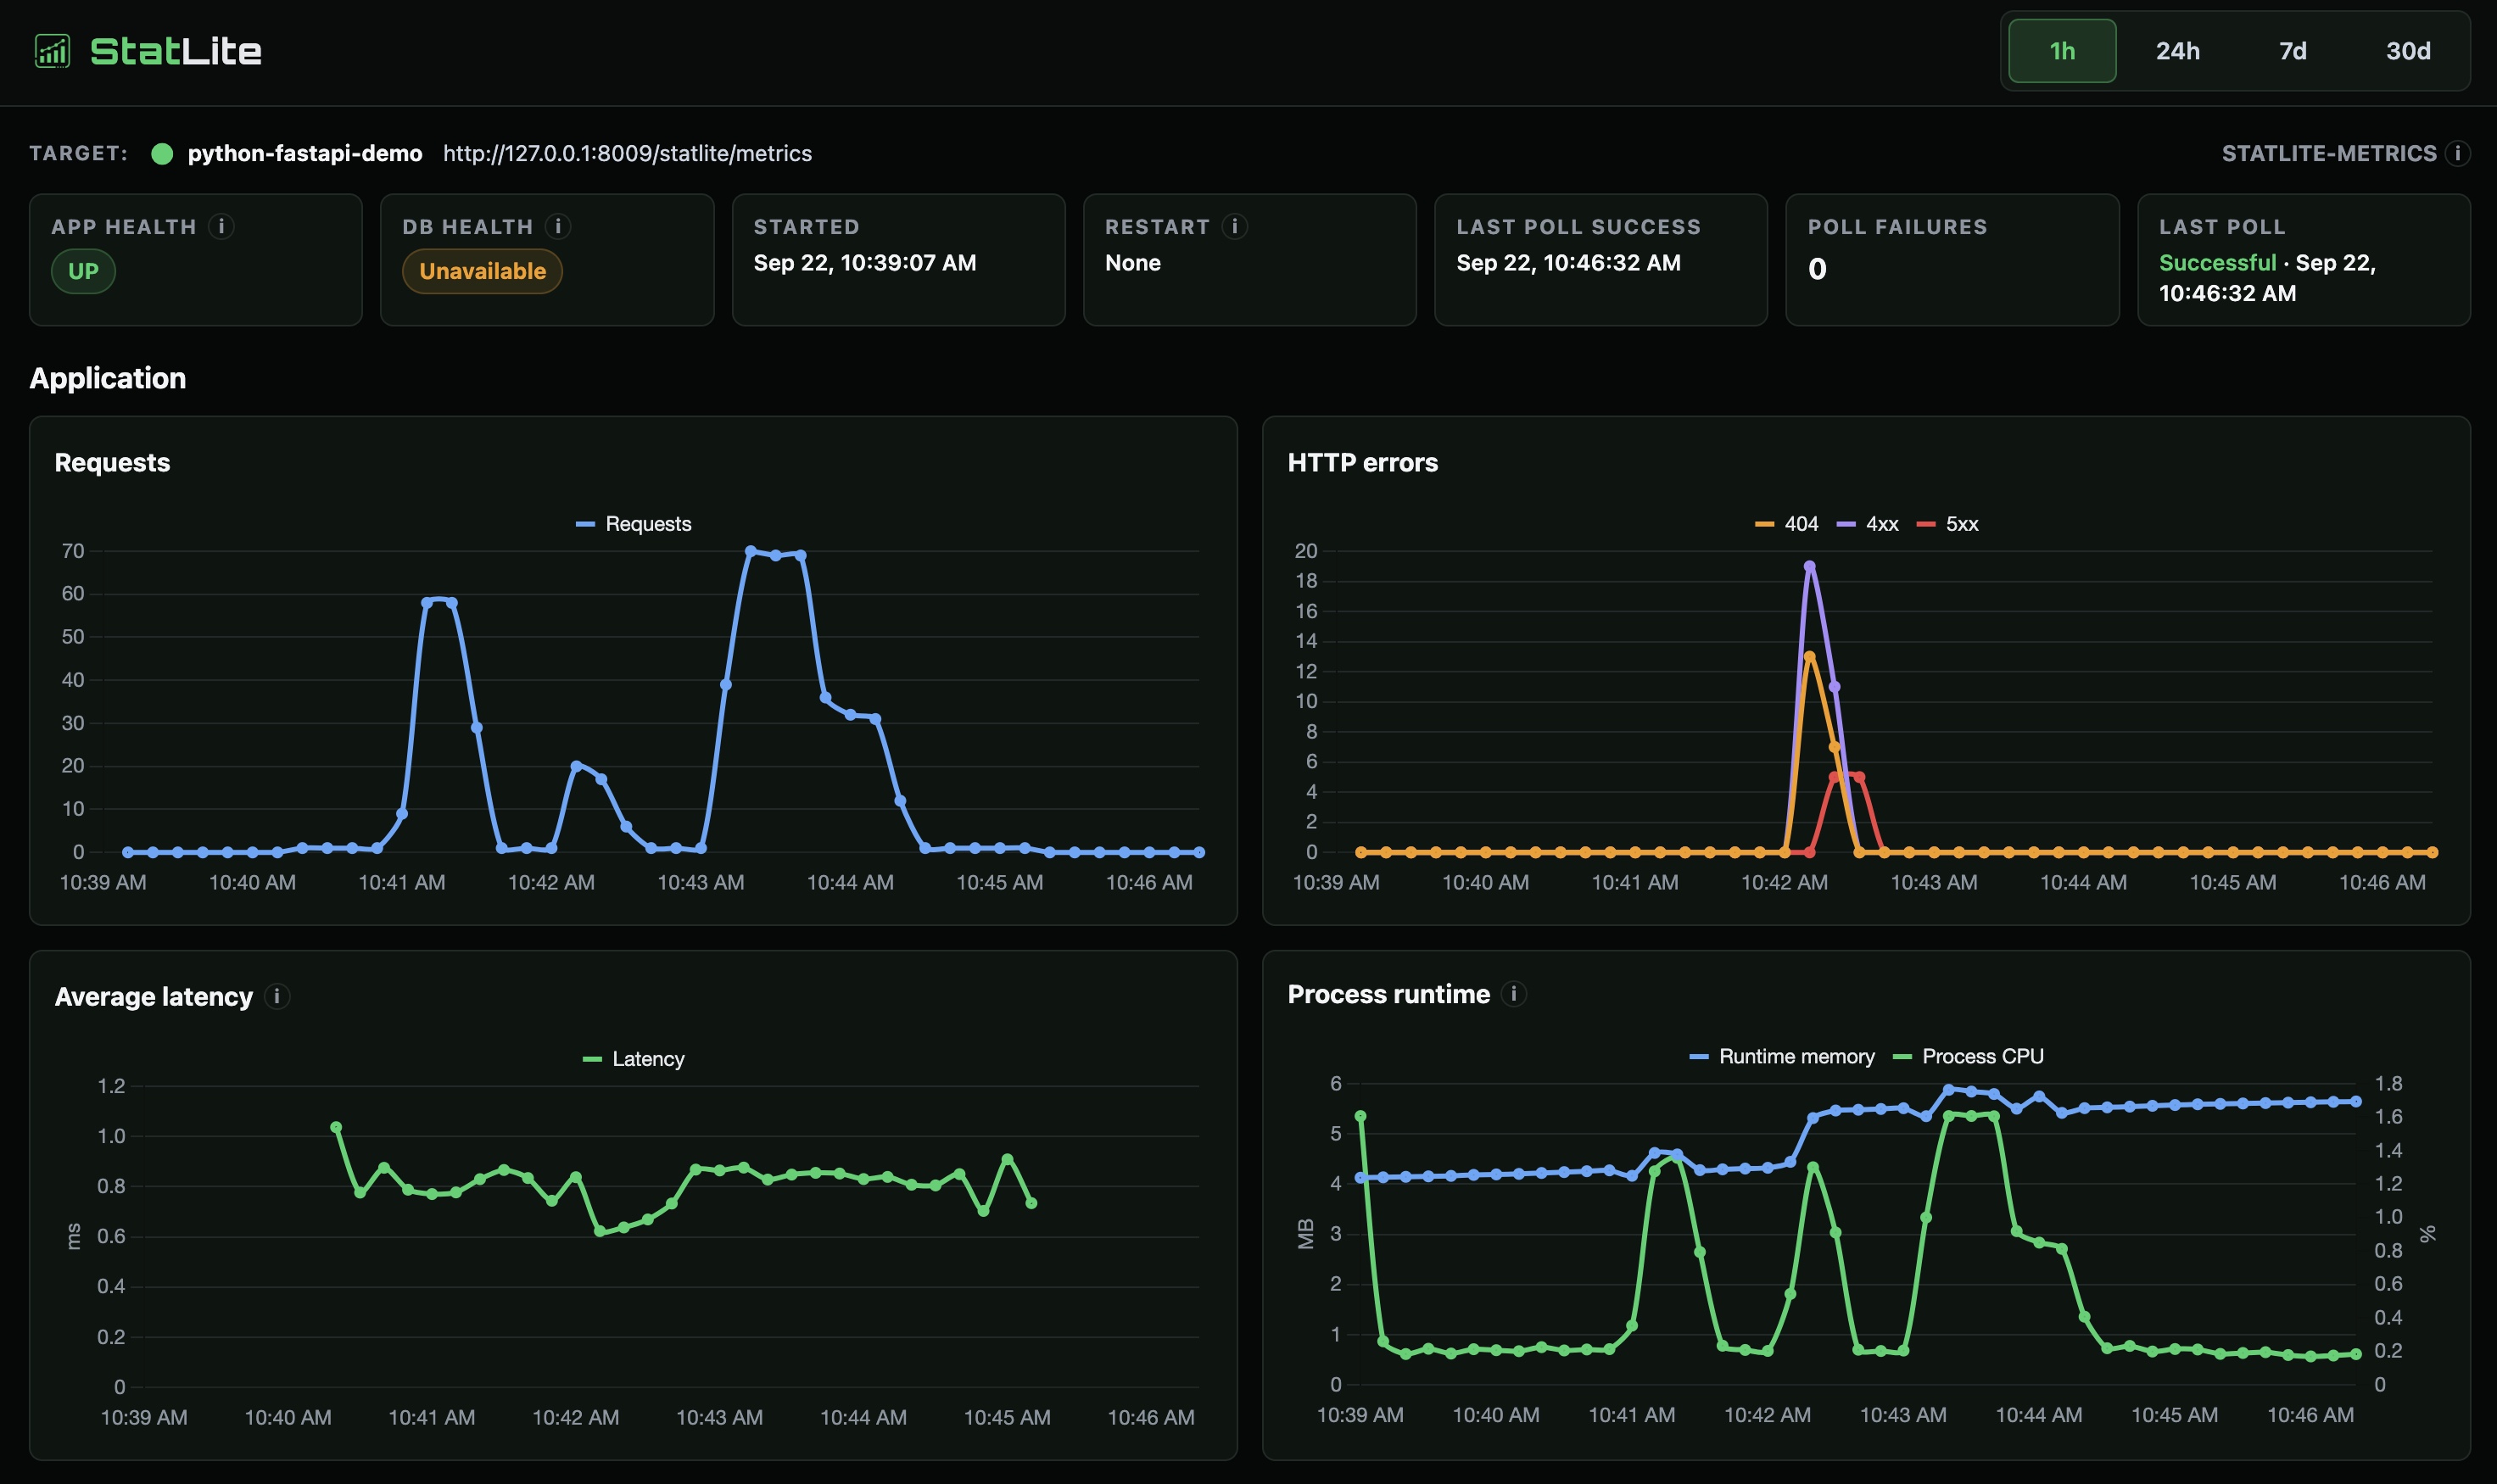
What you get
The FastAPI integration gives StatLite enough information to show:
- request traffic and 404, 4xx, and 5xx responses;
- average request latency;
- process CPU and, with the current helper, runtime heap and process identity;
- polling status, restart signals, and historical charts in SQLite.
When StatLite runs on the same host, its self-monitoring target can also show host CPU, memory, and disk history. Host metrics belong to the StatLite execution environment, not to FastAPI's application endpoint.
The screenshot uses a small steady request flow so the charts remain readable. The larger request bursts are easy to spot above that baseline. The HTTP error chart also keeps 404 separate from the aggregate 4xx series: a 404 is part of 4xx, so the 4xx line is expected to be at least as high. A mix of missing routes and another client error, such as a 405, makes that relationship visible without inventing an additional metric type.
One endpoint, one StatLite process
FastAPI middleware counts requests and accumulates request duration in memory. The application exposes those counters at:
GET /statlite/metricsStatLite polls that endpoint on a configured interval, calculates counter deltas, stores the observations, and presents the resulting history. The metrics endpoint is excluded from the application's own counters, so monitoring does not inflate the traffic or latency charts.
The integration uses the fixed statlite-metrics/v1 profile. It is deliberately small and bounded; it is not a Prometheus or OpenMetrics exporter.
Quick start
The repository contains a runnable FastAPI demo. If the statlite executable is not installed, follow the installation guide first. This is intentionally a local trial; from the demo directory:
- Create the environment and install the pinned dependencies:
python3 -m venv .venv source .venv/bin/activate python -m pip install -r requirements.txt - Start FastAPI with one worker and leave it running:
uvicorn app:app --host 127.0.0.1 --port 8000 --workers 1 - In another terminal, start StatLite with the demo configuration:
statlite --config statlite.yaml - Open the dashboard:
http://127.0.0.1:9090
You can optionally run statlite inspect http://127.0.0.1:8000 to verify that StatLite recognizes the integration and see a starter configuration for your own FastAPI app.
The FastAPI registration is tiny
To complete the integration, save the complete statlite_metrics.py helper from the minimal dependency-light integration section of the canonical FastAPI guide next to your application. Import StatLiteMetrics, create one instance, register its middleware, and expose GET /statlite/metrics by returning metrics.snapshot():
from fastapi import FastAPI

from statlite_metrics import StatLiteMetrics


app = FastAPI()
metrics = StatLiteMetrics()
app.middleware("http")(metrics.middleware)


@app.get("/statlite/metrics")
def statlite_metrics() -> dict:
    return metrics.snapshot()
Run FastAPI with one Uvicorn worker, then use the demo configuration to point StatLite at this endpoint. The complete helper, field semantics, tests, and deployment guidance are maintained in the canonical FastAPI integration guide.
Demo configuration
This is the configuration included with the runnable demo:
server:
  listen: "127.0.0.1:9090"

storage:
  sqlite_path: "./statlite-fastapi-demo.sqlite"

polling:
  # Short interval for a responsive local demo. Use 30s or longer in production.
  interval: "10s"
  timeout: "5s"

targets:
  - name: "python-fastapi-demo"
    type: "statlite-metrics"
    url: "http://127.0.0.1:8000/statlite/metrics"
The 10-second interval is intentionally short for fast local feedback. Use 30 seconds or longer for a normal deployment. The application integration must be registered before StatLite can collect this endpoint.
For a quick check, send a normal request, a missing-route request, and a safe application failure, then query the metrics endpoint. The demo's tests exercise the same normal, 404, 500, and metrics-exclusion behavior.
After the first few polls, the dashboard begins building historical points. Average latency is calculated from the change in cumulative duration divided by the change in request count. A quiet interval therefore has no meaningful latency value and may appear as a gap, while the steady baseline in the example keeps the latency chart readable between larger traffic events.
Three boundaries to keep in mind
One process or one worker
The simple helper keeps counters in the process. Use one Uvicorn worker for the default setup. Multiple workers need shared aggregation or stable per-worker targets; StatLite does not aggregate them automatically.
Keep the endpoint cheap
/statlite/metrics should return an inexpensive snapshot. Do not perform a database query or blocking dependency check on every poll. If the application has a cached dependency-health signal, it can expose that bounded value.
Keep it private
The endpoint exposes operational data, and the StatLite dashboard has no built-in authentication. Keep both reachable only through loopback, a private network, a VPN, an SSH tunnel, or an authenticated reverse proxy.
This setup is intentionally focused. It answers whether the application is receiving traffic, whether client or server errors appeared, whether average latency changed, and whether the local process or host is using more resources. It does not attempt to provide arbitrary business metrics, distributed traces, PromQL, or fleet-wide aggregation.
Next steps
For a small FastAPI deployment, this is the whole monitoring path:
FastAPI middleware
       |
/statlite/metrics
       |
    StatLite
       |
     SQLite
       |
    dashboard
Once you are happy with it locally, run StatLite alongside the FastAPI application on the VPS and keep both the metrics endpoint and dashboard private.
Start small. If you later need arbitrary metrics, labels, PromQL, tracing, fleet-wide aggregation, or sophisticated alerting, choose a system designed for that larger problem.