Two quiet Spring Boot instances held 20 PostgreSQL connections with Hikari’s default pool sizing. Allowing excess idle connections to retire brought that total to 2, associated with approximately 29 MiB lower PostgreSQL cgroup memory.
I left HikariCP’s minimumIdle and maximumPoolSize unset. Both resolved to 10: Hikari’s default idle target equals its maximum, so idleTimeout has no connections above the target to retire.
For scale, ten application instances with Hikari’s default pool size of ten can demand 100 PostgreSQL connections even while idle. On a server configured with max_connections=100, that demand can exhaust ordinary application capacity before traffic returns: PostgreSQL reserves some slots for privileged connections, so fewer than 100 may be available to application roles. This is a sizing example; the experiment below used two instances.
The experiment record includes the source, reproduction instructions, screenshots, and recorded data. This article uses Spring Boot 4.1.1, HikariCP 7.0.2, and PostgreSQL 16.15 on Java 25.
Testing the quiet period
I ran two copies of a tiny Spring Boot JDBC application using HikariCP against PostgreSQL. Instance A received a short burst; B started before A finished and stayed busy longer. That created three useful observations: both pools under demand, A idle while B remained busy, and both idle before the next burst.
Each configuration ran twice in mirrored order, with fresh application processes. An independent sampler recorded per-instance PostgreSQL connections and Hikari total, active and idle counts. The applications and database shared a two-vCPU, 1 GiB Linux VM with no swap. This kept the setup compact; it was not a distributed application benchmark.
Three Hikari settings describe the comparison:
maximumPoolSizesets the pool’s connection ceiling: ten in this test.minimumIdlesets the idle connection target. The reclaim profile used one, allowing the pool to retain less capacity between bursts.idleTimeoutretires idle connections aboveminimumIdle. Hikari’s documented default is 10 minutes, and it does nothing whileminimumIdleequalsmaximumPoolSize. The reclaim profile used ten seconds to compress the lifecycle into a short experiment. That duration is not production tuning advice. The other two profiles set the timeout to zero so pool sizing could be compared on its own.
| Profile | minimumIdle | maximumPoolSize | idleTimeout |
|---|---|---|---|
| Default sizing | unset → 10 | unset → 10 | disabled |
| Reclaim | 1 | 10 | 10 seconds |
| No-reclaim mechanism control | 1 | 10 | disabled |
Lifetime and keepalive were deliberately disabled for all profiles. This compares default pool sizing, not every untouched Hikari default. Each workload request intentionally held a database connection for one second, making simultaneous occupancy visible.
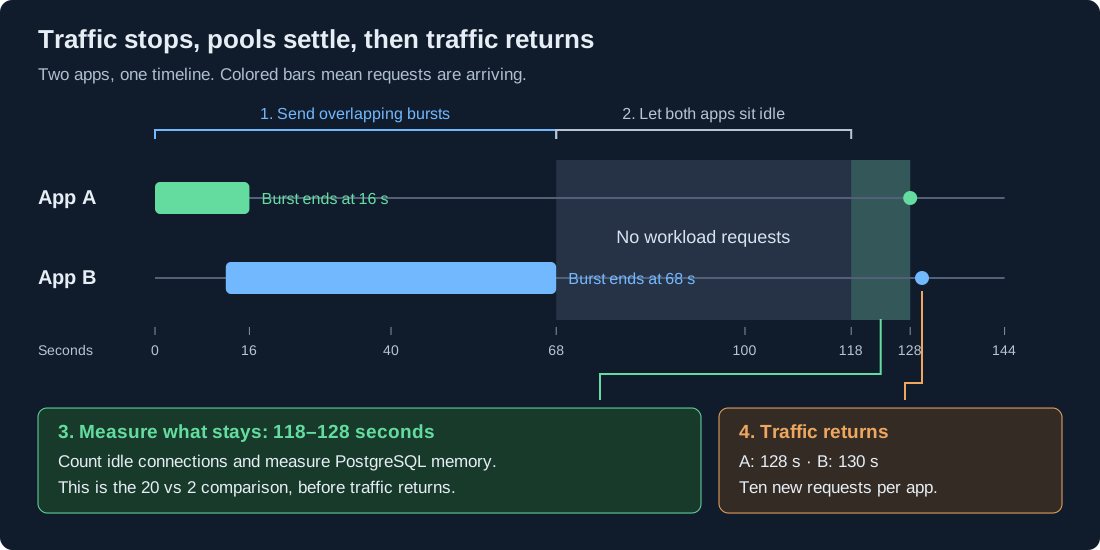
Twenty connections became two
Both pools reached ten connections in every scenario, with actual elevated overlap verified by the runner. Hikari totals agreed with PostgreSQL counts.
| Configuration | Peak aggregate | A idle, B busy: A / B | Both quiet: A / B | Quiet aggregate |
|---|---|---|---|---|
| Default sizing, both repeats | 20 | 10 / 10 | 10 / 10 | 20 |
| Reclaim, both repeats | 20 | 1 / 10 | 1 / 1 | 2 |
| No-reclaim control, both repeats | 20 | 10 / 10 | 10 / 10 | 20 |
Connection counts are medians over ten one-second samples per scenario; peaks are observed maxima. PostgreSQL cgroup memory was requested every fifth sample, so each of these 10-second windows has two cgroup readings, and the memory medians are of those two. Reclaim released 18 of the 20 connections during the quiet window, while retaining the ability to grow to ten per instance.
PostgreSQL’s accounted memory moved with the connection count. Cgroup memory is the cluster’s charged memory, including cache, on this PostgreSQL 16 server (shared_buffers 128 MiB).
| State | Connections | PostgreSQL cgroup memory |
|---|---|---|
| Reclaim, both quiet | 2 | 28.4–28.5 MiB |
| Reclaim, A idle and B still busy | 11 | about 42.9 MiB |
| Default or no-reclaim, both quiet | 20 | 57.4–57.9 MiB |
| Reclaim, after the revisit reopened both pools | 20 | about 57.1 MiB |
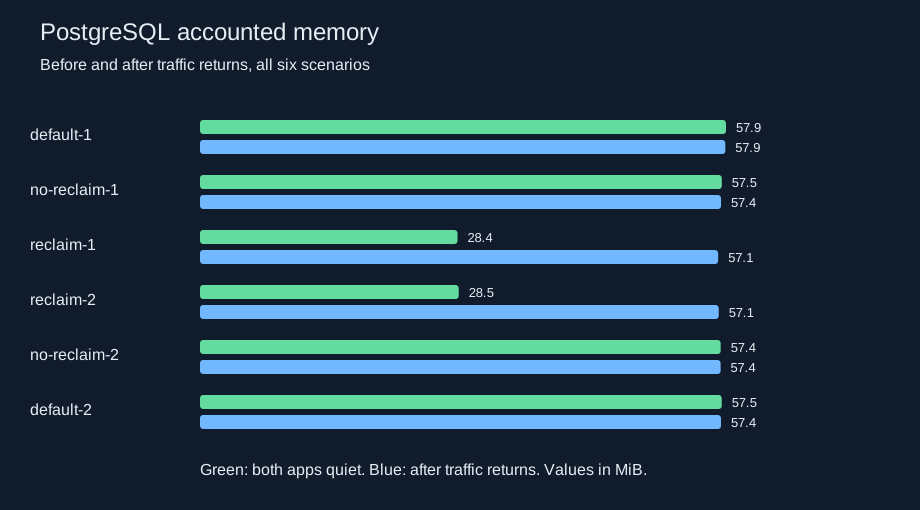
The same split was already visible before the burst. Default sizing started at 20 connections and about 56–58 MiB. Both elastic profiles started at 2 connections and about 28–29 MiB. Where private PostgreSQL memory was recorded in the quiet window, it was about 12 MiB with two connections and about 36 MiB with twenty. Each application JVM stayed around 190–207 MiB either way. The memory change is on the database server.
A returned to one connection while B still held ten and continued serving its longer burst. Retirement followed each instance’s demand rather than requiring the entire application pair to be quiet.
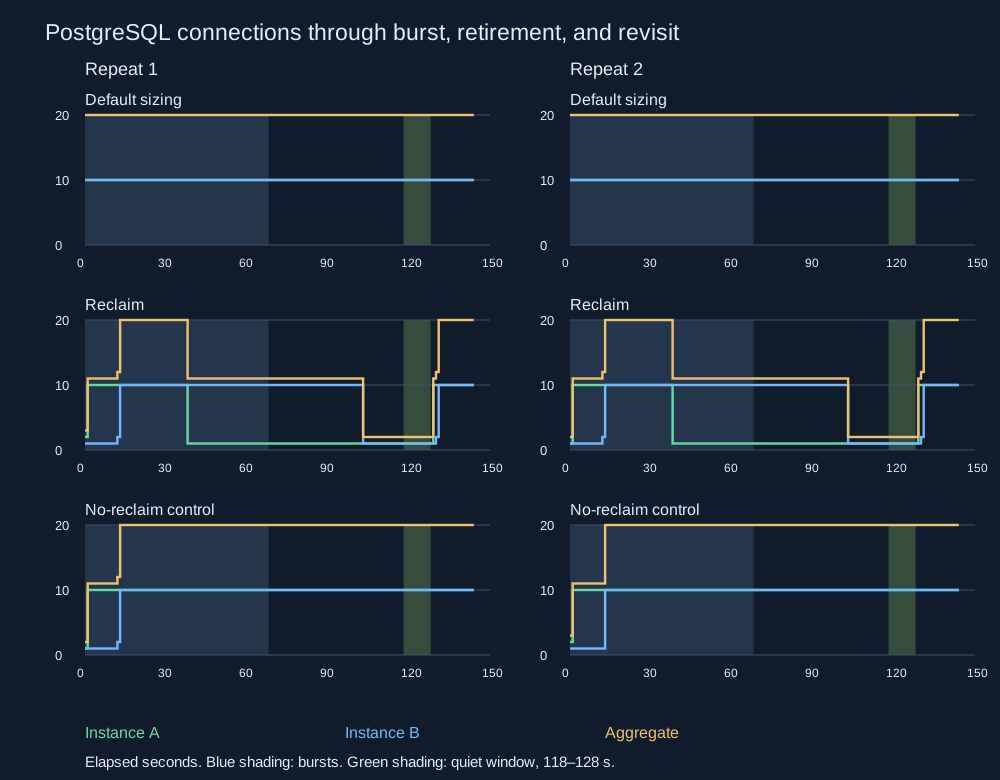
Starting small did not guarantee shrinking
The no-reclaim profile isolates the mechanism: it started at one connection per instance, allowed each pool to grow to ten, and disabled idle retirement.
After traffic stopped, it retained ten per instance and about 57 MiB of PostgreSQL cgroup memory. A lower minimumIdle did not release the connections opened during the burst while idleTimeout was off. Retirement is what released that capacity, and the PostgreSQL memory went with it.
The reclaim pools also started at one and grew to ten. Their difference was what happened afterward: idle capacity above the target could retire.
Rebuilding capacity took time
Reclamation was not free. To test whether reclaimed capacity could be restored when traffic returned, each instance later received ten simultaneous requests. This return of traffic is the revisit. The reclaim pools reopened successfully, but median connection-acquisition times were approximately 194–207 ms, compared with under 3 ms when connections had been retained.
Median total revisit request time was approximately 1.44–1.46 seconds with reclaim, versus 1.02–1.03 seconds with retained pools. Those totals include the common intentional one-second connection hold. Each request waited for all ten connections to be acquired before running its one-second database operation. The slowest acquisition took about 430 ms, explaining much of the additional request latency.
All 2,280 measured requests succeeded. All six scenarios were valid, with zero sampling errors or supporting warnings. After revisits, the pools again held ten connections each, showing successful regrowth after retirement.
These short synthetic waves show an observed cost of rebuilding pool capacity. They do not establish general production latency.
| Scenario | A acquisition | B acquisition | A request | B request |
|---|---|---|---|---|
| default-1 | 1.9 ms | 1.5 ms | 1019.4 ms | 1017.0 ms |
| no-reclaim-1 | 2.8 ms | 0.9 ms | 1022.6 ms | 1018.7 ms |
| reclaim-1 | 204.1 ms | 202.4 ms | 1450.7 ms | 1439.3 ms |
| reclaim-2 | 193.7 ms | 206.8 ms | 1436.7 ms | 1457.1 ms |
| no-reclaim-2 | 1.3 ms | 0.7 ms | 1022.1 ms | 1018.2 ms |
| default-2 | 2.2 ms | 0.4 ms | 1025.9 ms | 1030.6 ms |
Per-instance medians from ten requests per revisit. Request times include the intentional one-second connection hold.
The practical change
PostgreSQL has a finite connection limit. This server allowed 100. Two quiet default pools used 20 of those 100 slots while serving nothing, with a larger PostgreSQL footprint. The pools that could retire excess idle connections used 2 slots and about half that PostgreSQL memory, then grew back to 20 when the ten-request wave returned.
Choose maximumPoolSize from how many database operations must run at once and from PostgreSQL's connection capacity. Set minimumIdle to the number of connections worth keeping warm. Leave idleTimeout enabled. Hikari’s configuration documentation gives a 10-minute default. Choose a production timeout based on application demand and the cost of rebuilding connections; this experiment did not validate production timeout settings. minimumIdle=1 is the setting that demonstrated the mechanism here. An application with frequent bursts can keep a higher idle target and still stay below the maximum.
Hikari’s fixed-pool recommendation is aimed at spike latency. The tradeoff in this run was lower idle PostgreSQL resource use versus slower connection acquisition after a quiet period.
PgBouncer can help when PostgreSQL has too many connections, but it adds another component to operate. Its transaction-pooling mode requires care with session-dependent features, such as LISTEN and session-level advisory locks. Modern PgBouncer supports protocol-level prepared statements with a nonzero max_prepared_statements setting. Before introducing a connection pooler, I’d check whether the application is retaining unnecessary idle connections and measure what happens when those connections are allowed to retire. This experiment did not test PgBouncer.
Monitoring with StatLite
I used StatLite to watch request rate, latency, JVM runtime memory, and CPU during the run. These dashboards provide workload context; connection counts and PostgreSQL memory came from the independent measurements above.
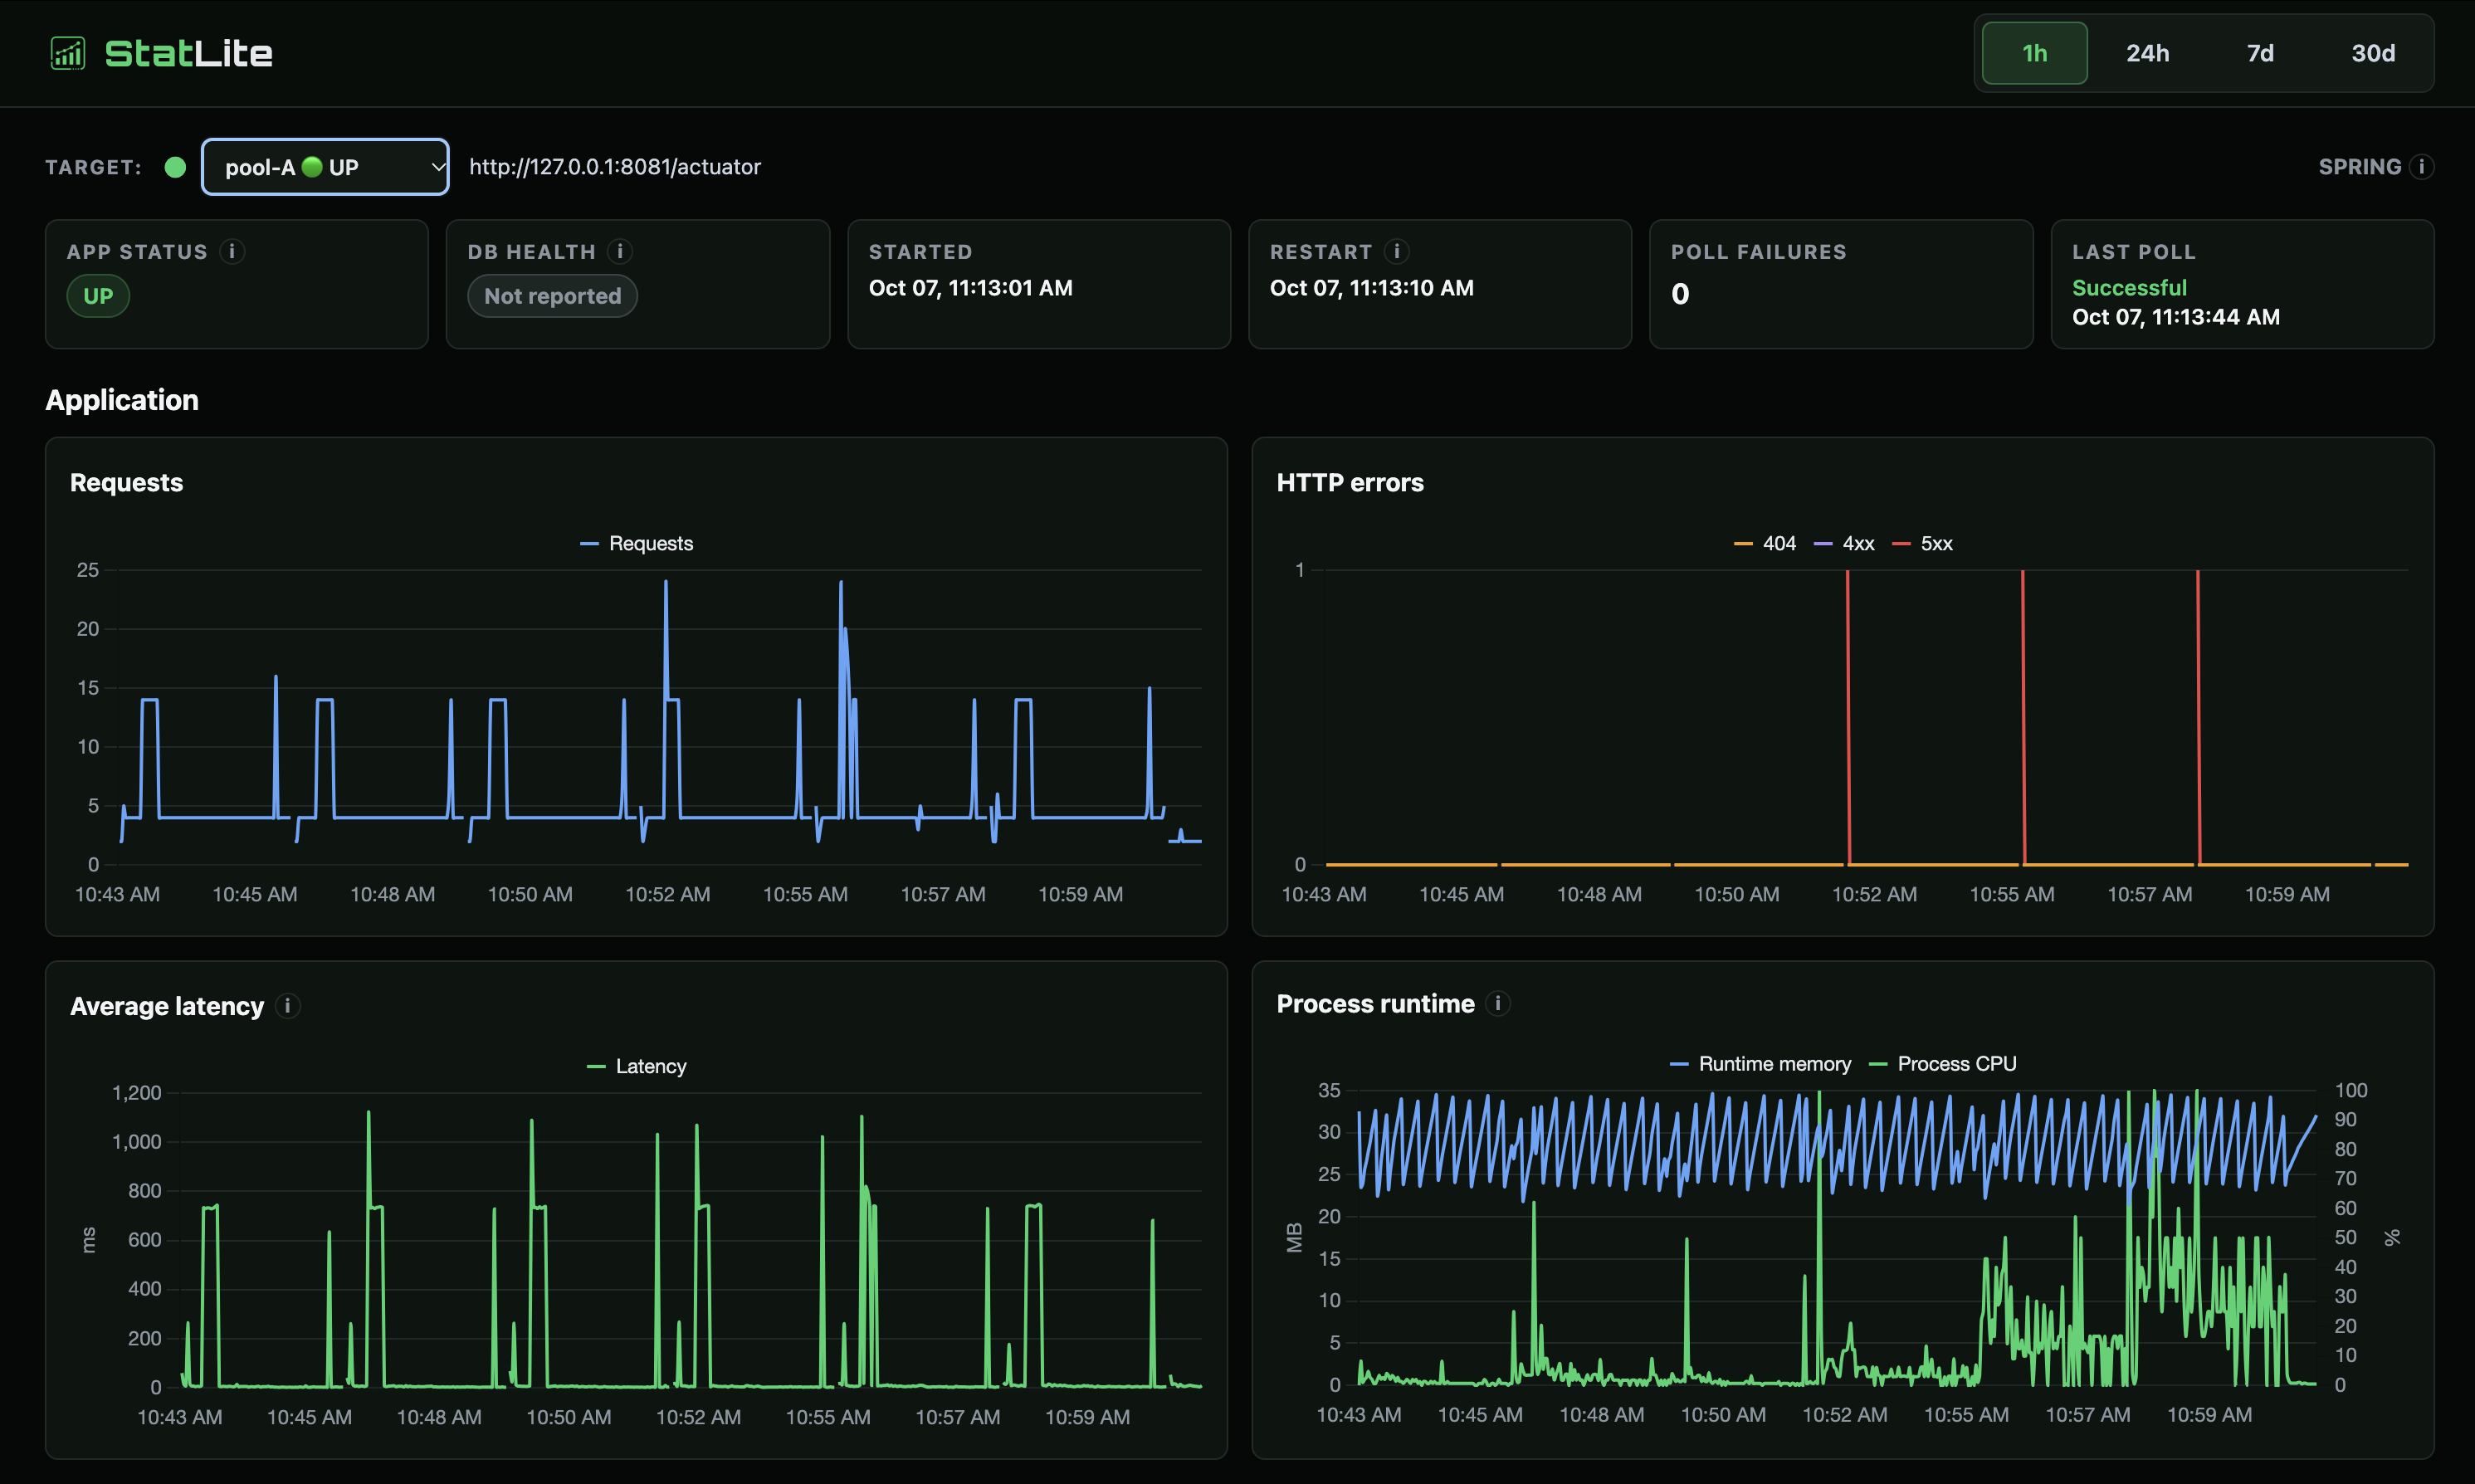
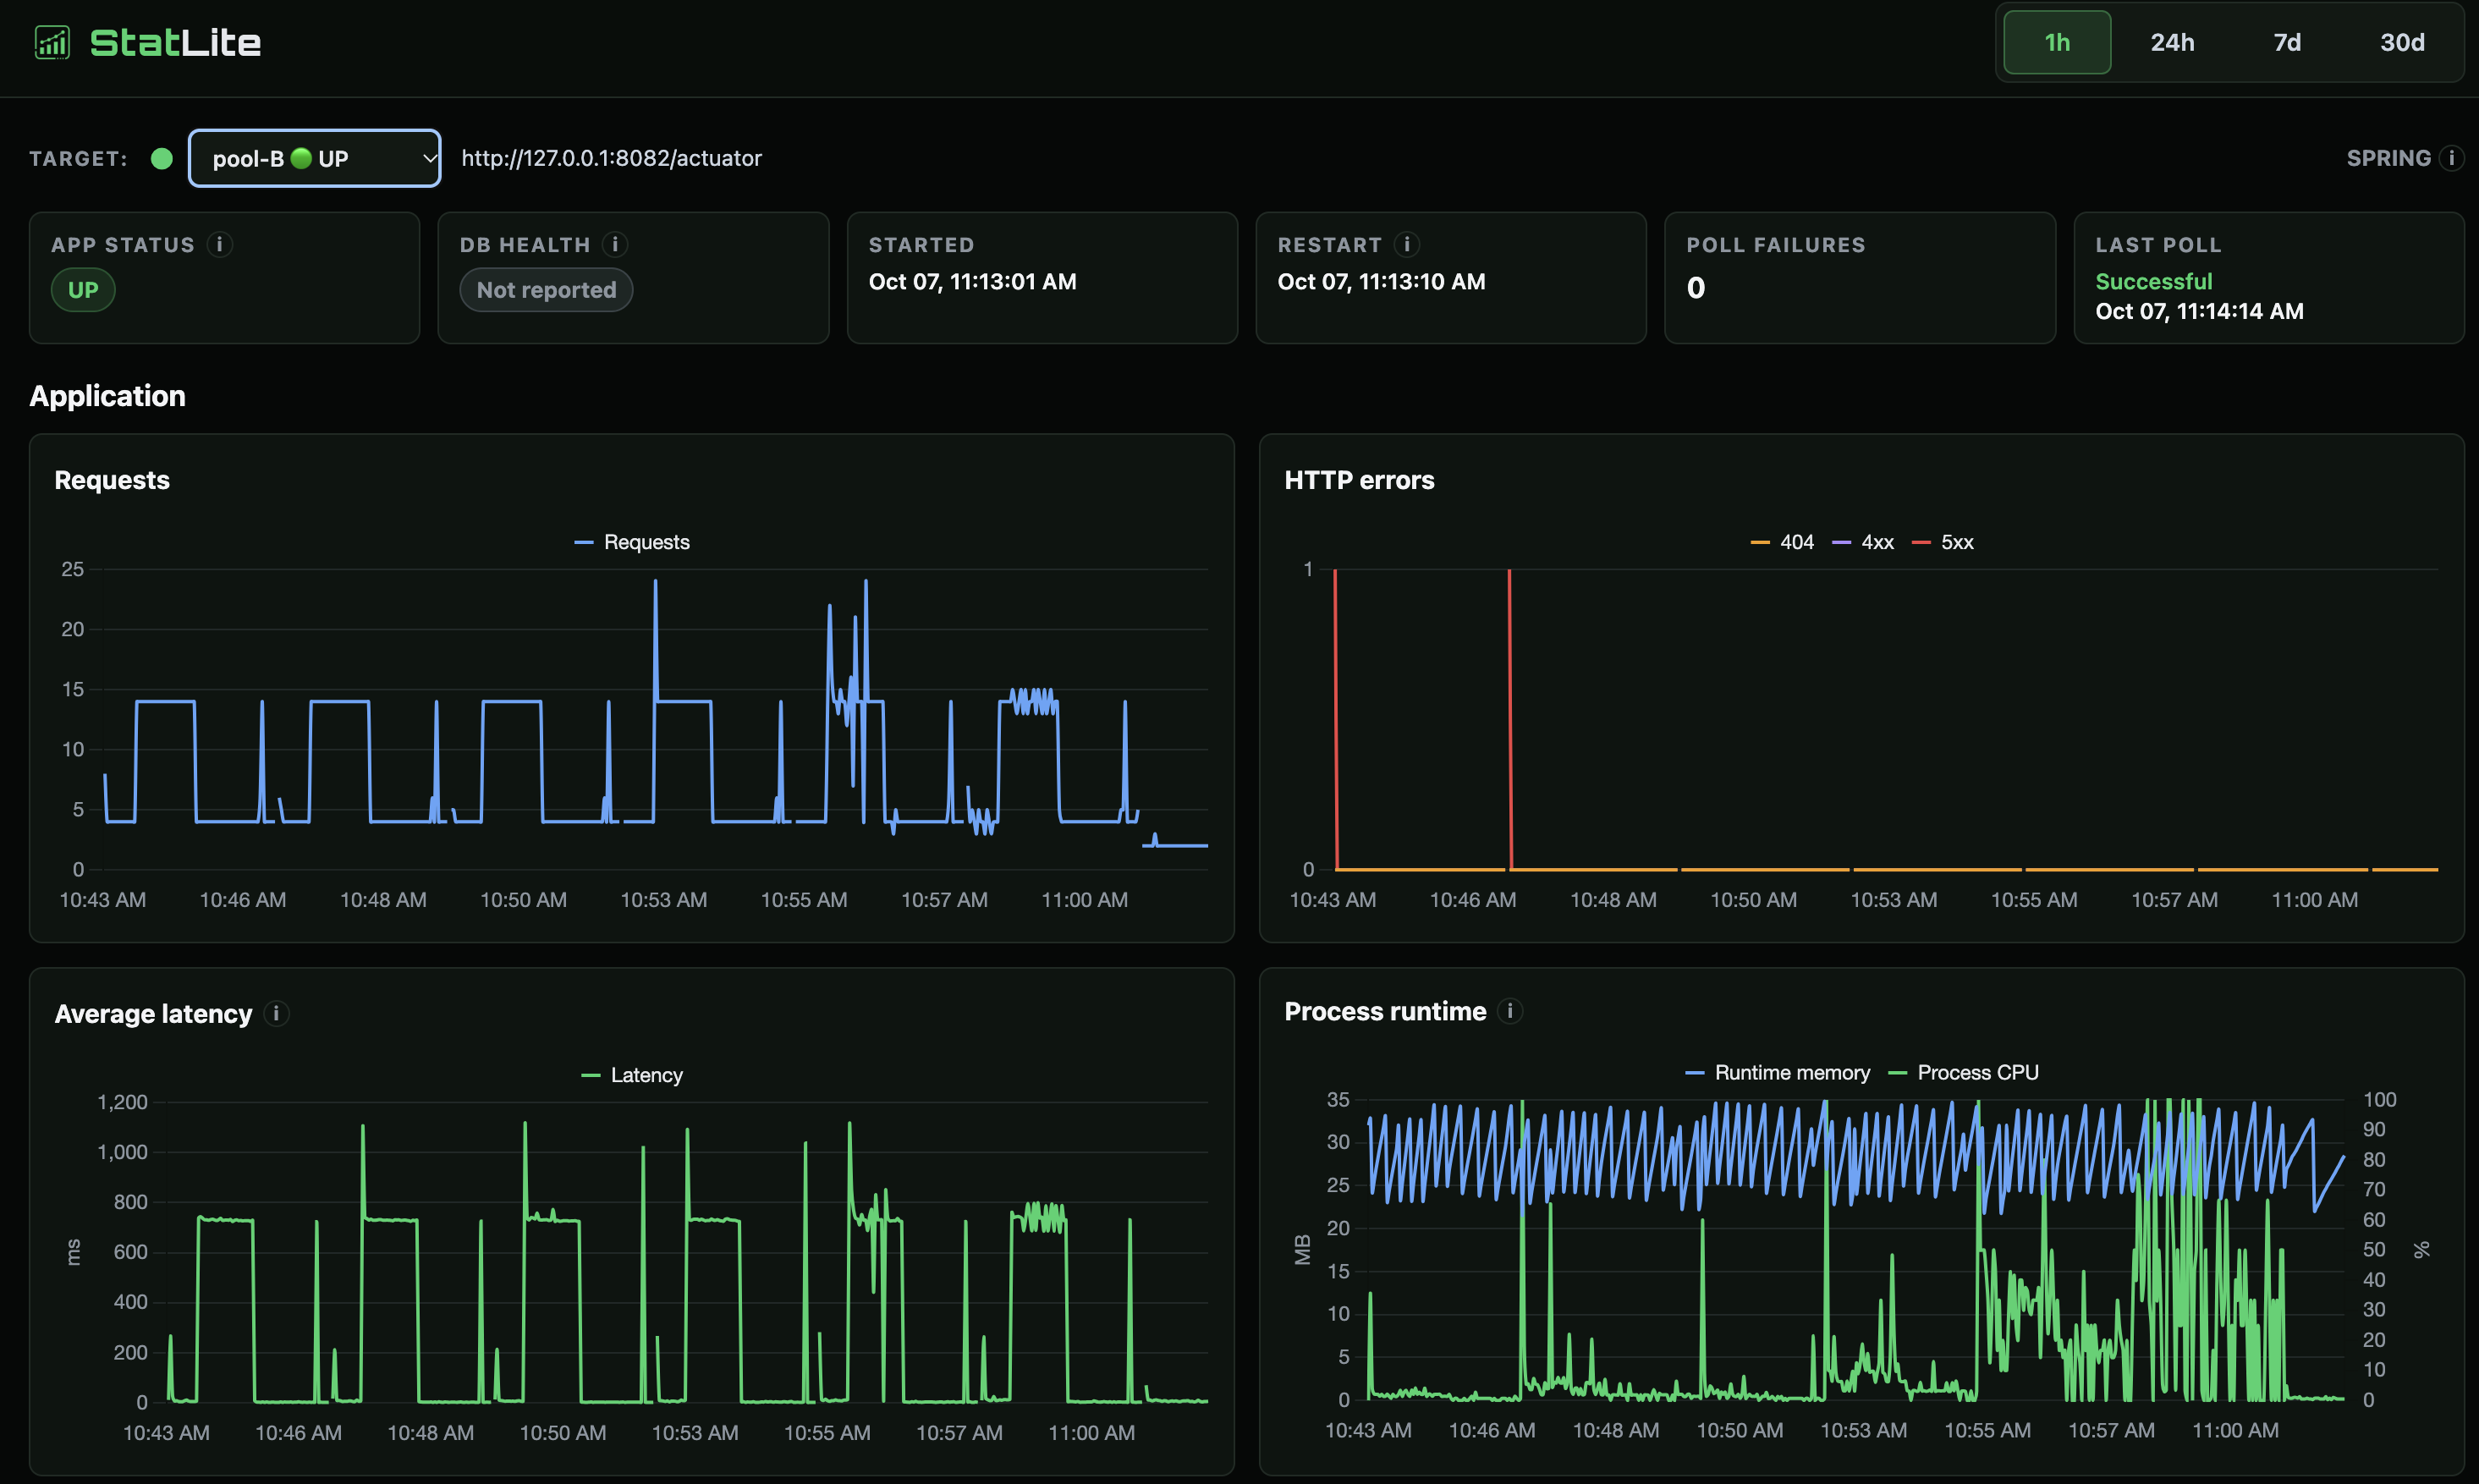
Screenshots show the recorded workload history; the live status cards belong to later inspection apps. DB health: Not reported reflects a deliberate fixture setting: Spring Boot’s DB-health check was disabled so monitoring would not borrow connections and disturb idle retirement. The apps verified database access at startup. The red 5xx spikes came from startup health checks returning HTTP 503 before the apps were ready; the measured JDBC workload requests all returned HTTP 200.
Limits and takeaway
In both repetitions, releasing 18 idle connections was associated with about 29 MiB lower PostgreSQL cgroup memory. When traffic returned, the pools grew back to 20 connections, and the database memory footprint returned with them, at the cost of slower connection acquisition.
These measurements describe idle PostgreSQL backends in one small-server setup, rather than a general memory cost per connection. Cgroup accounting includes cache as well as connection-private memory; sessions doing more substantial database work can have a different footprint.
Sources
The public experiment record includes the application source, pool settings, environment details, and measurements from all six scenarios. The analysis script checks the recorded connection counts, memory readings, and request timings against the summary.
Experiment record Recorded data Reproduction guide Analysis script