A previous JPA-versus-JDBC experiment showed noticeable Hibernate overhead in a small Spring Boot application. For this follow-up, I wanted to keep persistence simple with equivalent JDBC implementations and add Micronaut to see where it fits alongside Spring Boot and Quarkus.
I built equivalent versions of a quote-history application and ran them one at a time in the same 1 GiB Linux VM. Each received the same scripted API traffic, synchronized quotes from the same local fixture, and stored them in file-backed H2. Then I restarted all three together for a separate observation.
All three completed the workload without a scripted request error. Quarkus had the lowest median resident memory and reached readiness fastest in this run. Micronaut was close in memory, while Spring used more. CPU usage was low for all three, although Micronaut used more CPU than Quarkus in both the application and whole-VM measurements.
The curated experiment contains the method, application sources, screenshots, and downloadable data. This article describes one practical engineering investigation, not a general ranking of the frameworks.
The application behind the numbers
Market Replay is the small quote-history application I built for this comparison. It fetches market quotes from a local replay service over HTTP, validates them, stores them in H2 through JDBC, and exposes current values and history through an API and browser page.
The fixture replays a recorded trading session for three symbols. It runs locally and advances every 60 seconds, so the measured application never waits on an external market-data service. Each successful synchronization stores three observations. The API serves the latest quote per symbol and a bounded history.
The implementations share the fixture, database version, schema, SQL, payloads, and browser assets. They also share a JDK scheduled executor with a 60-second fixed delay after each synchronization completes. Keeping that scheduling mechanism common avoids accidentally comparing different scheduling semantics.
The framework integration still differs. Spring Boot 4.1.1 uses Spring MVC, JdbcClient, and HikariCP. Quarkus 3.40.1 uses Quarkus REST, JDBC, and Agroal. Micronaut Platform 5.2.1, with Core 5.2.11, uses Netty, JDBC, and HikariCP. Micronaut uses Jackson 3; Spring and Quarkus use Jackson 2. All three use H2 2.4.240 and connection pools bounded from one to four connections.
These are complete application stacks. The experiment does not isolate the cost of a framework's dependency injection container or HTTP server.
One environment, fresh JVMs
The guest was Ubuntu 24.04 x86_64 under Lima VZ on an Intel Mac, with two vCPUs, 1 GiB RAM, and no swap. All three applications used Temurin Java 25.0.4.1+1 LTS and the same flags:
-Xms32m -Xmx192m -XX:+UseG1GC -XX:ActiveProcessorCount=2The 192 MiB maximum is a heap limit, not a total process memory limit. Resident memory also includes class metadata, compiled code, thread stacks, and other native allocations.
Before measuring, I launched each application for a short smoke check with separate databases and monitoring storage. That checked packaging, persistence, health, metrics, and collection while warming guest filesystem state. Each measured launch was still a fresh JVM with a fresh H2 database. Startup here means process launch to externally observed health plus a persisted first batch, rather than a framework's startup log or a pristine VM cold start.
The order was Spring, Quarkus, then Micronaut. Each ran for 15 minutes from readiness. The script requested latest and history every five seconds, rising to every second during minutes seven through ten, then returning to baseline. Each completed 638 requests with zero errors.
Sequence: Spring (15 min), Quarkus (15 min), Micronaut (15 min), then all three together (15 min). In each individual window: warmup 0–3, baseline 3–7, busier 7–10, return 10–15 minutes. The fixture and monitor run throughout.
Memory: a modest difference between Quarkus and Micronaut
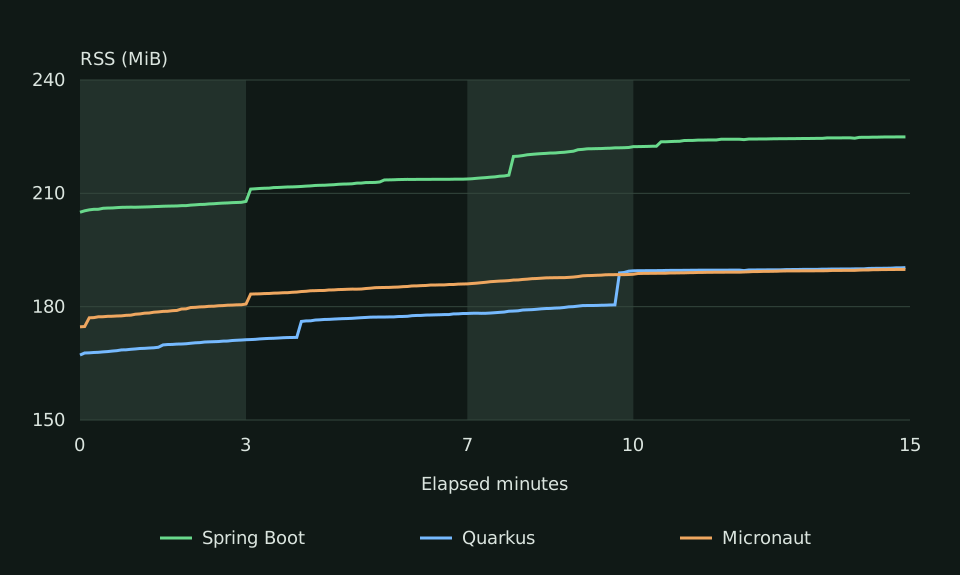
Linux process RSS was sampled independently every five seconds, producing 180 observations per application window. The headline figures include the first three minutes designated runtime warmup.
| Application | Launch to readiness | Median RSS | Peak sampled RSS |
|---|---|---|---|
| Spring Boot | 4.90 s | 214.3 MiB | 224.9 MiB |
| Quarkus | 2.25 s | 178.4 MiB | 190.3 MiB |
| Micronaut | 2.54 s | 186.7 MiB | 189.9 MiB |
Quarkus's median was 8.3 MiB below Micronaut's. Their sampled peaks were almost identical. Spring's median was 36.0 MiB above Quarkus's and 27.7 MiB above Micronaut's.
The time dimension matters too. RSS increased across the short test for all three applications. During the final five-minute interval, median RSS was 224.4 MiB for Spring, 189.7 MiB for Quarkus, and 189.4 MiB for Micronaut. Quarkus's lower whole-window median therefore does not imply a large gap at every point in the run.
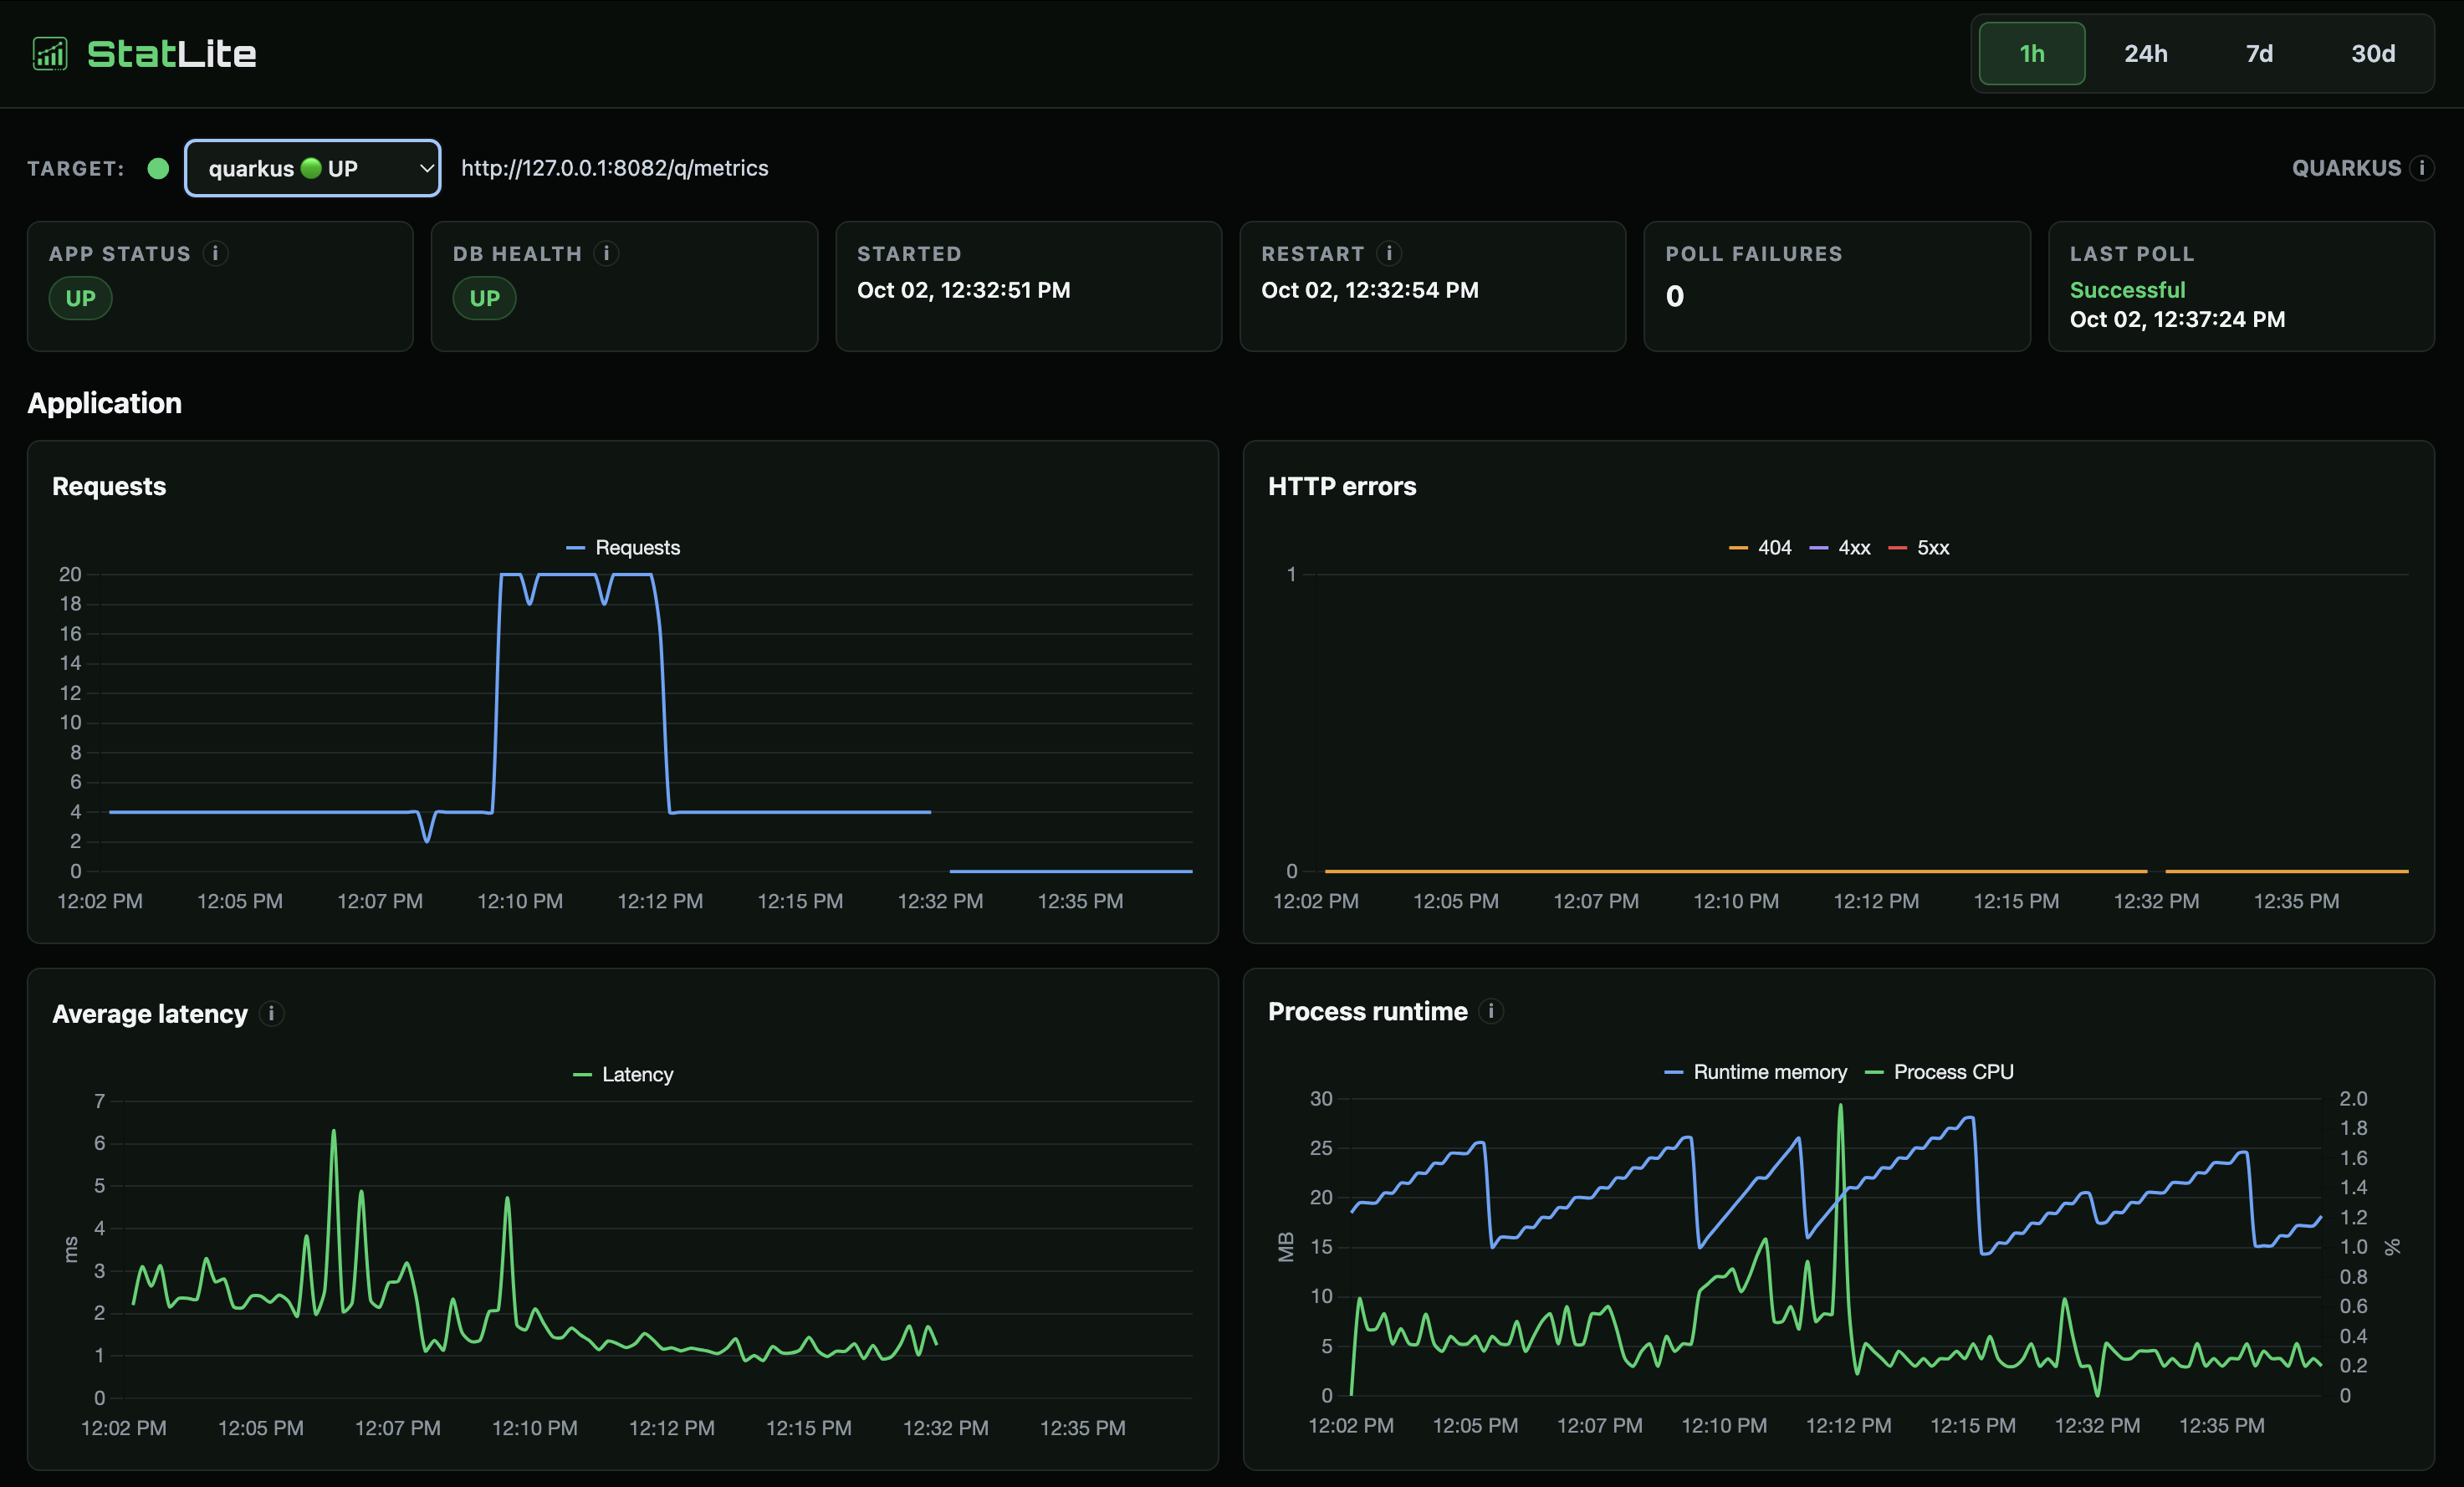
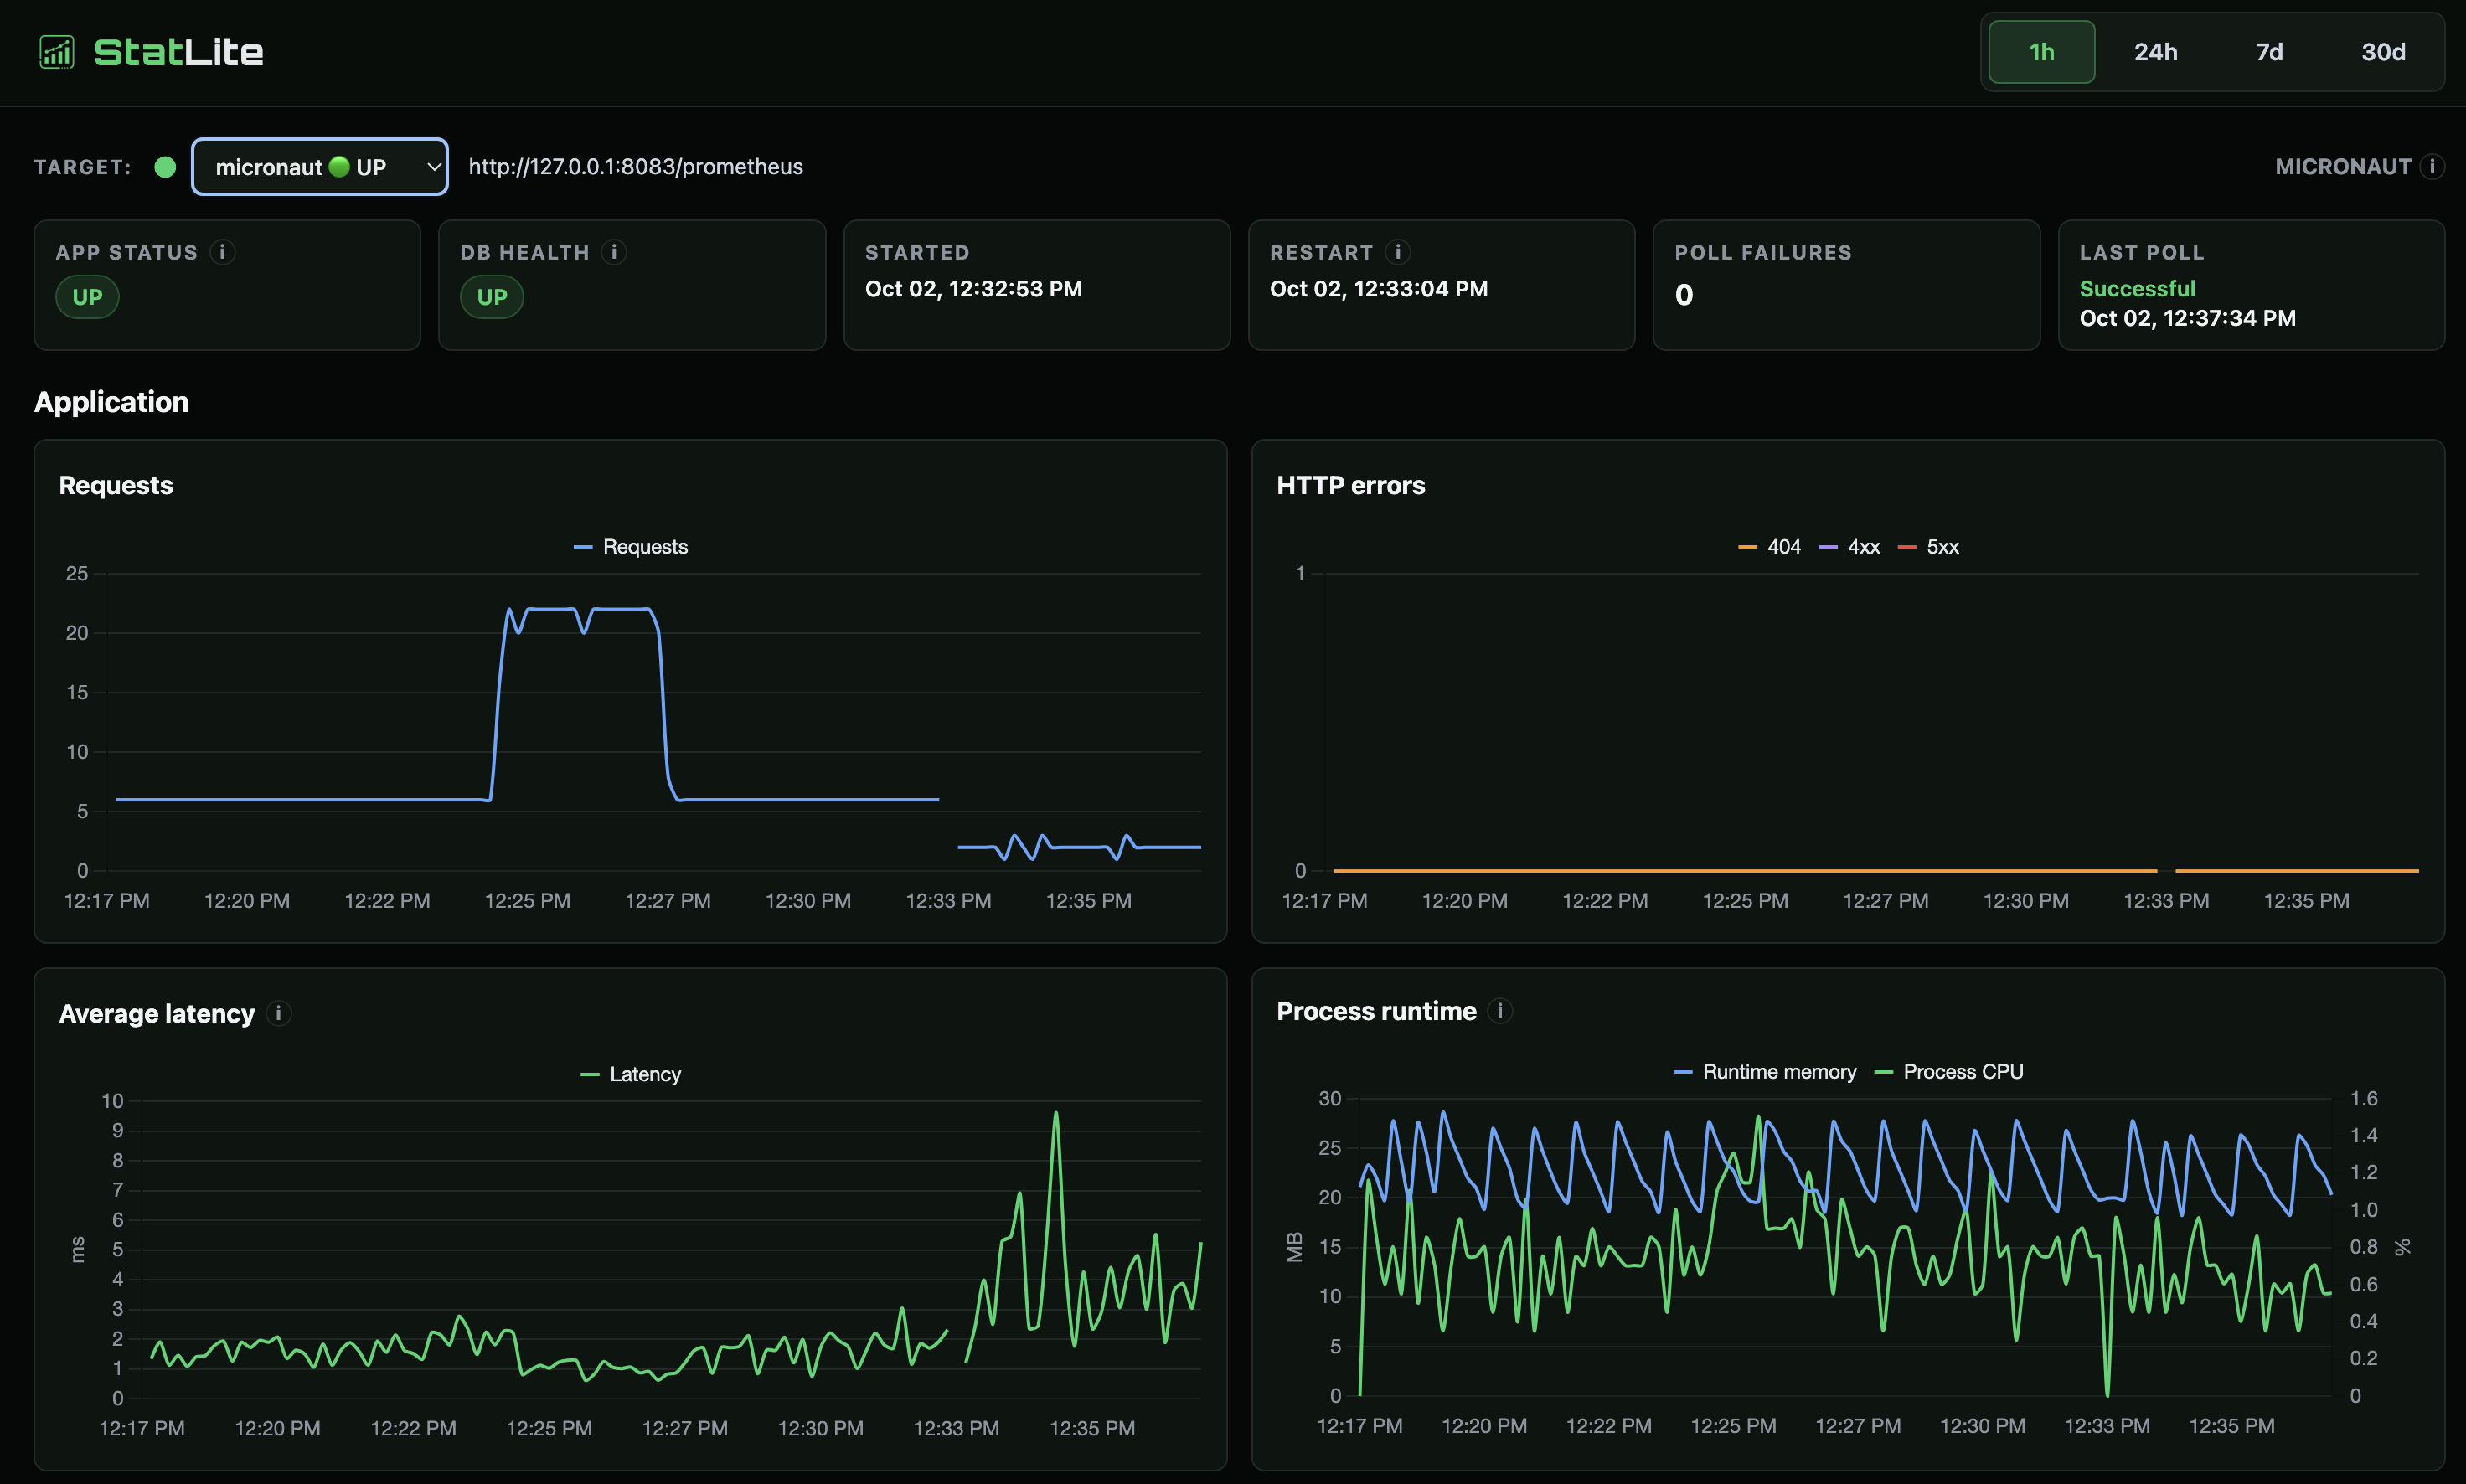
The dashboard's JVM runtime-memory curves were much smaller and showed repeated rises and drops. That is consistent with allocation and collection, while process RSS includes memory beyond the JVM runtime-memory series. The screenshots and RSS measurements answer different questions; their values should not be interchanged.
CPU: low absolute usage, a visible Micronaut difference
The process charts suggested higher CPU for Micronaut than Quarkus. The whole-VM measurements showed the same direction.
| Application window | Mean app CPU, one-core basis | Mean host CPU, two-core VM basis |
|---|---|---|
| Spring Boot | 0.539% | 0.727% |
| Quarkus | 0.439% | 0.498% |
| Micronaut | 0.790% | 0.817% |
These are means of 13 one-minute aggregated values per window, excluding startup and partial boundary buckets. Application CPU is expressed as a percentage of one core; host CPU is a percentage of the VM's total two-core capacity. The two columns have different denominators and cannot be summed.
Micronaut's mean host CPU was approximately 0.32 percentage points above Quarkus's. During the busier interval, host means were 0.892% for Spring, 0.808% for Quarkus, and 1.052% for Micronaut. This was a light workload with plenty of CPU capacity, not a throughput or saturation test.
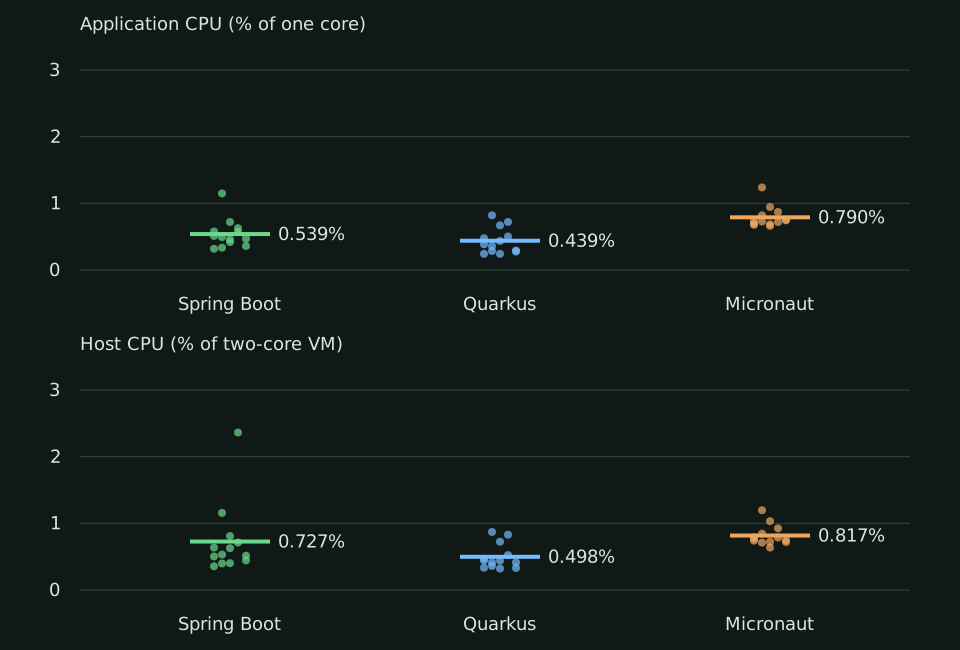
Host CPU includes application work, the fixture, StatLite, and guest services. These observations establish a difference during the recorded windows; they do not identify its cause.
All three together
After the individual windows, I restarted all three applications into fresh databases and observed them together for 15 minutes without scripted API traffic. Quote synchronization and monitoring continued.
Median RSS was 212.7 MiB for Spring, 171.4 MiB for Quarkus, and 180.3 MiB for Micronaut. StatLite used 21.5 MiB median RSS, and the fixture approximately 22.4 MiB. Mean whole-VM CPU was 1.039% over the selected minute buckets.
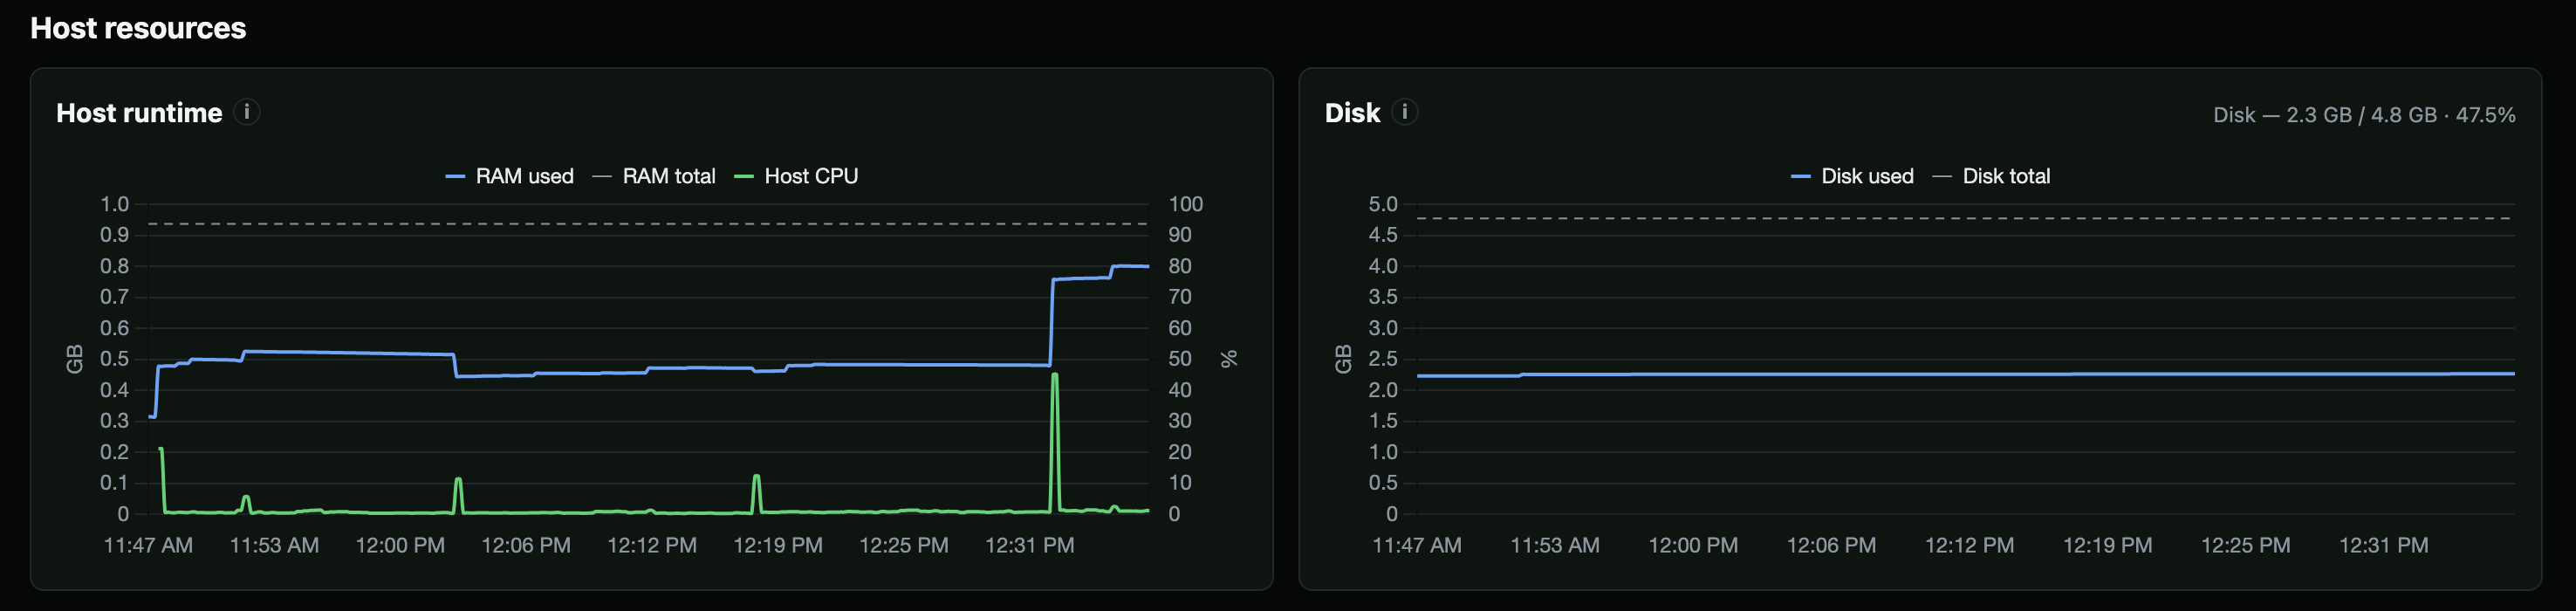
The host screenshot shows RAM rising from approximately 0.48 GB to 0.8 GB when all three launch, below the guest's displayed total of approximately 0.94 GB. A startup CPU spike subsides, and disk usage changes little.

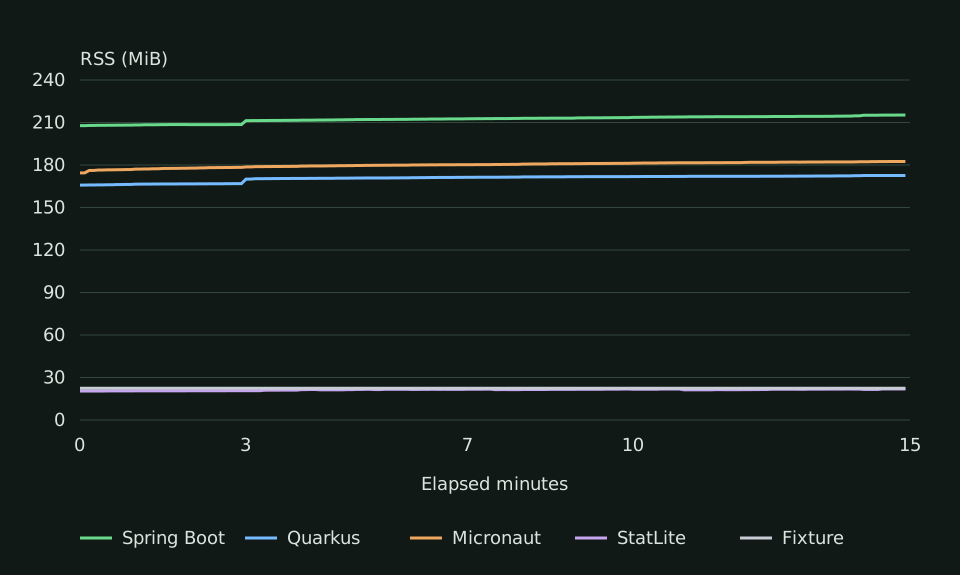
Latency increased after the shared restart, particularly for Spring. That transition is visible in the screenshots, but different request populations and fresh JVM warmup prevent a controlled latency ranking. The shared phase also has a different workload from the individual tests, so its memory and CPU values remain a separate observation.
Monitoring the transitions
I used StatLite to monitor the three apps and itself throughout the sequence. Micronaut support was added recently, so this experiment also exercised that integration alongside Spring Boot and Quarkus. All targets stayed configured even when their applications were stopped. That exercised unavailable targets, recovery, and planned restarts alongside the comparison.
Self-monitoring succeeded in every recorded ten-second status check. Active applications recovered collection after an initial status lag. All three were healthy in the operator screenshots, and the captured kernel journal contained no OOM messages. The fixture recorded no availability loss or replay regression.
There are useful instrumentation details in the evidence. Quarkus counted approximately two fewer requests per polling interval than Spring and Micronaut under the same scripted traffic. That does not change the runner's identical 638-request totals, but it limits direct dashboard request/latency comparisons. Spring's DB health card showed “Not reported,” which is missing detail rather than a database-failure observation.
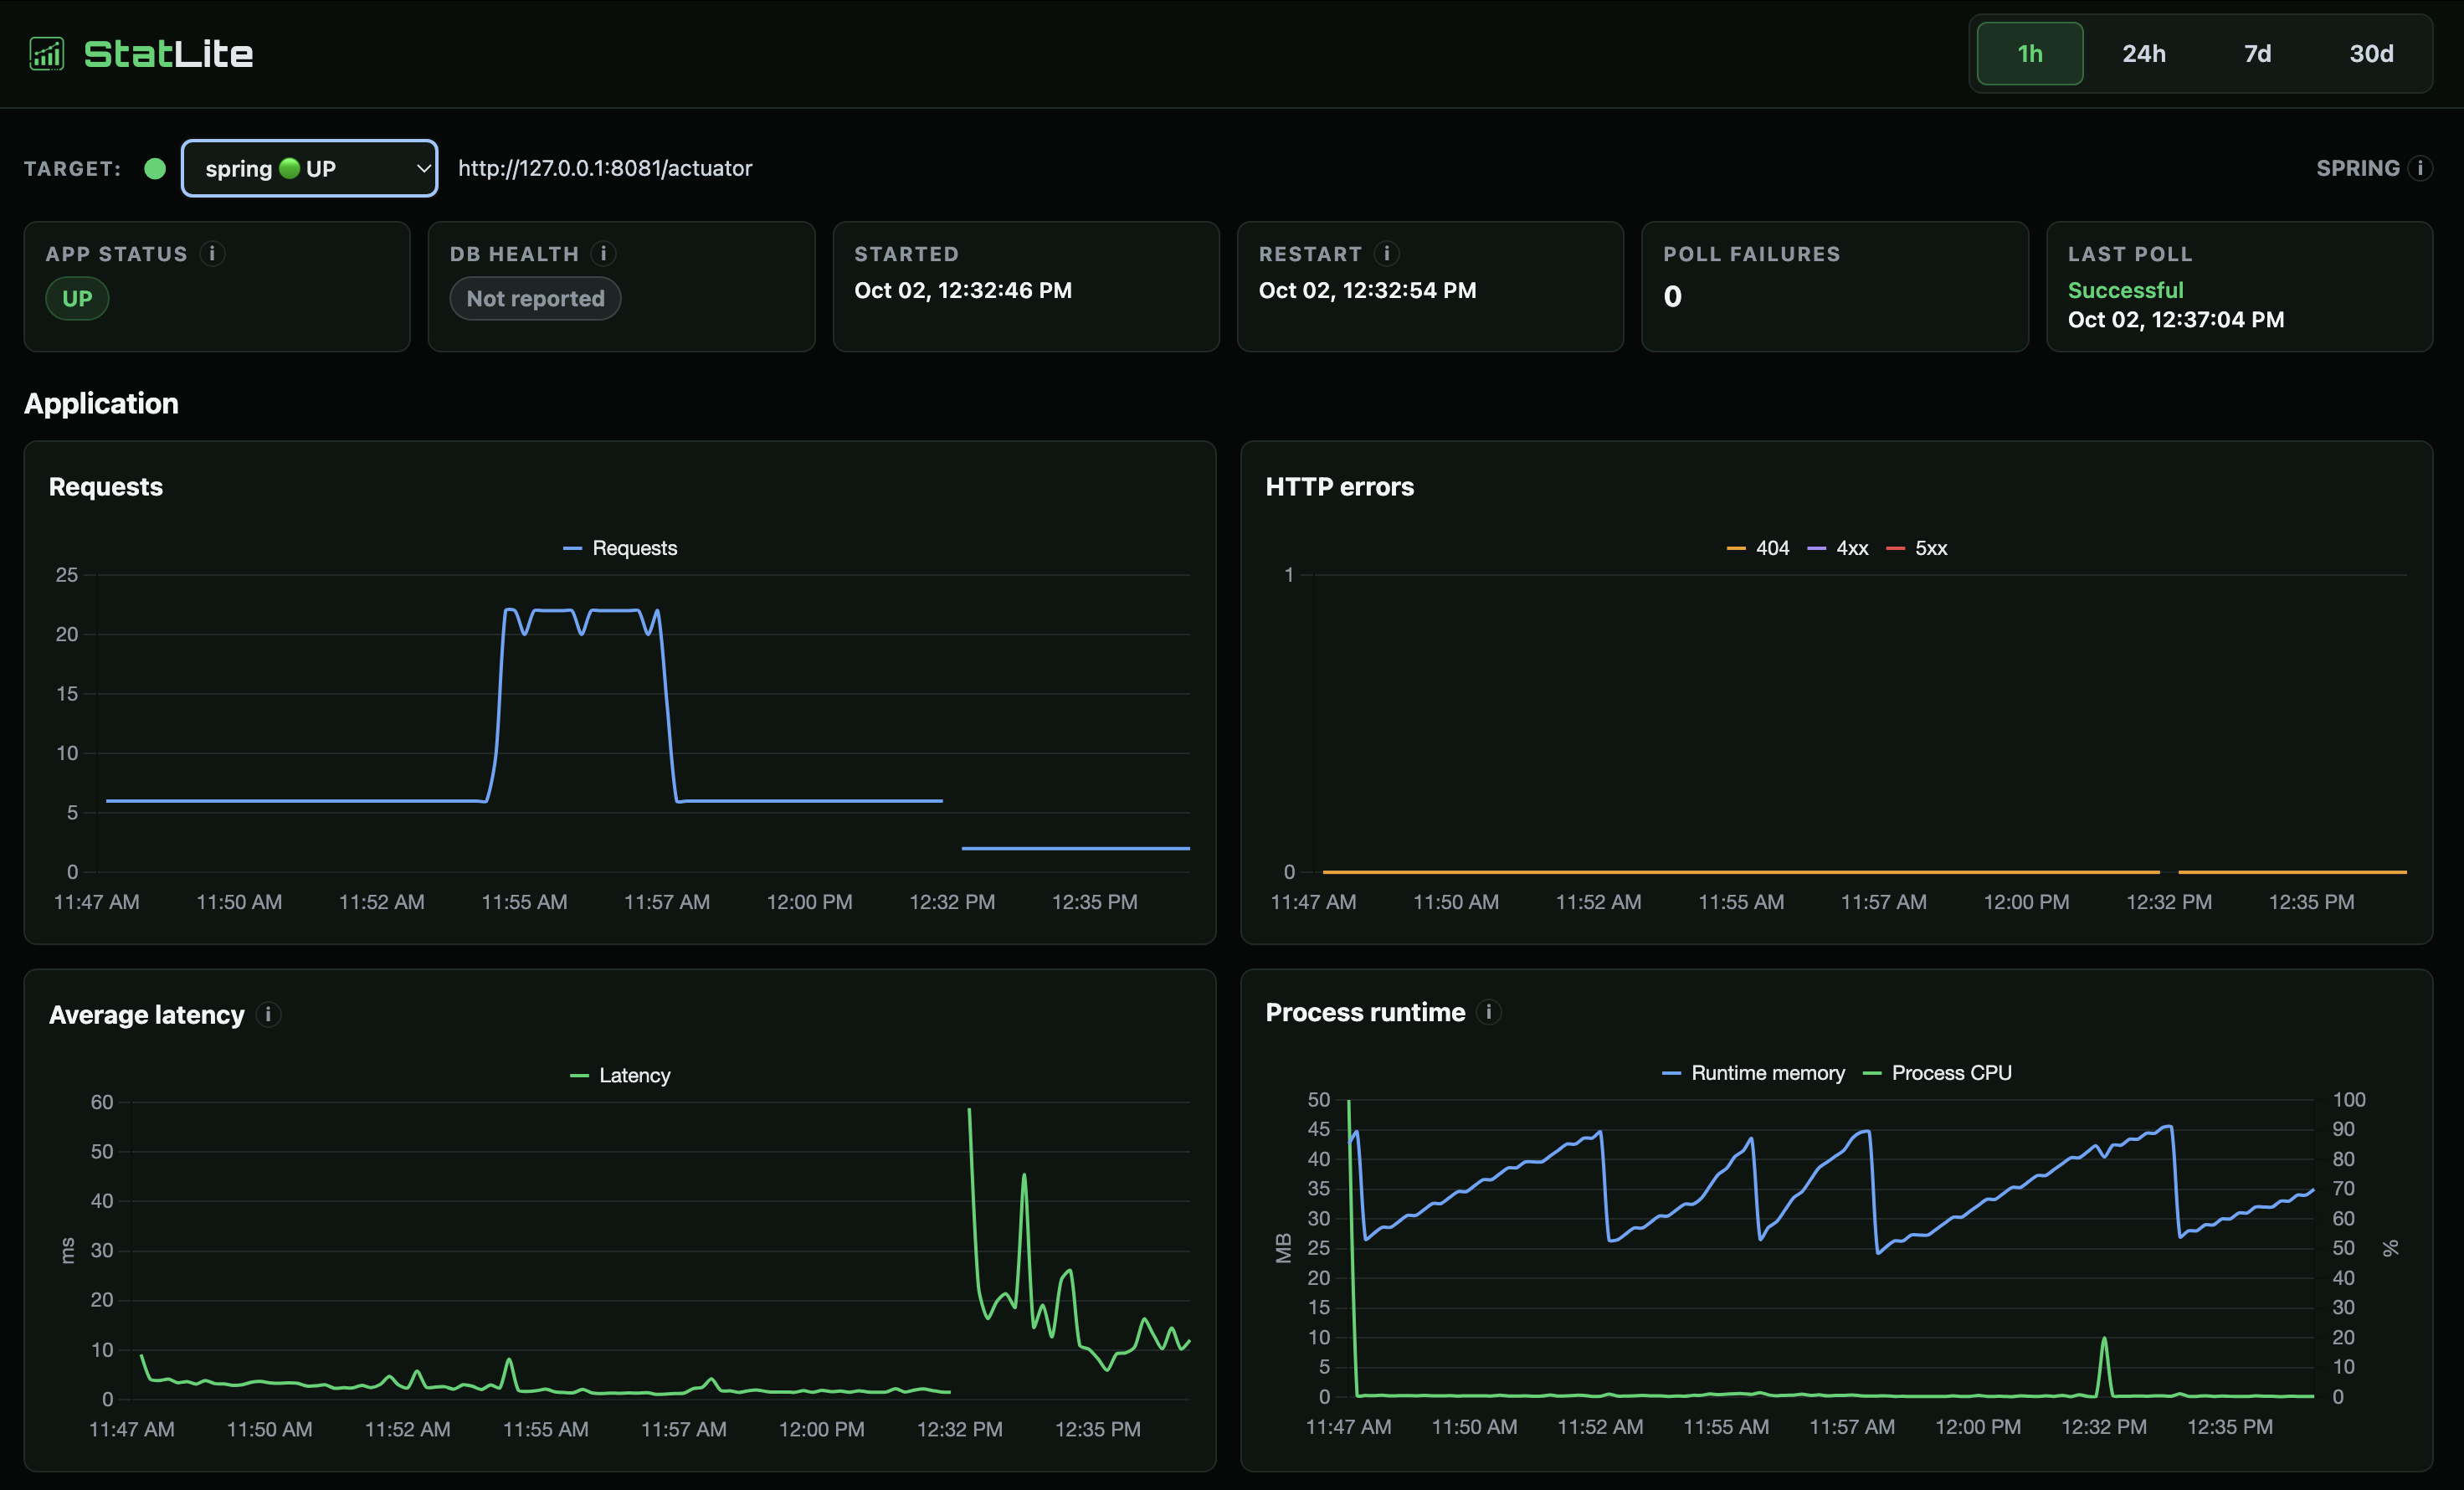
If this kind of lightweight dashboard would be useful for your own Spring Boot, Quarkus, or Micronaut application, StatLite supports all three.
What this run supports
For this application and JVM profile, Quarkus reached readiness sooner and had the lowest whole-window median RSS and CPU. Micronaut's median memory was close to Quarkus's, and their final-interval medians and sampled peaks were very close. Spring carried a larger resident footprint, while completing the same workload successfully.
Those conclusions apply to this recorded setup. There was one fixed-order run, prepared filesystem state, and a continuous fixture whose starting sample changed between phases. The experiment does not establish repeated-trial variance, a long-term memory plateau, maximum throughput, or an overall winner.
The operator opened the dashboard during the shared window, which may affect StatLite's own HTTP metrics. Screenshots precede that window's end; later inspection samples are excluded from the timed comparisons.
An earlier Spring/Quarkus experiment provides context, but used Hibernate and a different resource/environment profile. Its results should remain separate from this JDBC comparison. The earlier article discusses the memory-pressure observations.
The experiment record includes the source, measurements, and analysis script.