A small Java application with JDBC, H2, and monitoring, compared with an equivalent Spring Boot deployment.
Why test Javalin on 256 MiB?
A small self-hosted application still needs more than an HTTP endpoint. It needs persistent storage, enough operating-system headroom to keep working, and a way to observe what happens when requests arrive. For developers running personal services or small VPS deployments, those requirements can matter more than maximum throughput.
I wanted to investigate a recurring question: how comfortably can a useful application run on a small server, with persistent storage and basic monitoring, while leaving enough resources for the operating system? Javalin is a lightweight option worth testing for a straightforward JSON API. I used Spring Boot as a familiar reference, with the same application behavior.
This experiment ran in a VPS-sized local Alpine Linux VM, rather than a commercial provider's VPS. Each application used JDBC and file-backed H2, with StatLite collecting metrics alongside it. Traffic was deliberately modest. The goal was to observe startup, memory pressure and useful responses within a small resource budget.
Test setup
| Component | Configuration |
|---|---|
| Operating system | Alpine Linux 3.24.2, x86_64, Lima VM |
| CPU and memory | 1 vCPU, 256 MiB configured; approximately 214.9 MiB usable guest RAM |
| Swap | 512 MiB disk swap |
| Java | OpenJDK 25.0.4 |
| Shared JVM flags | -Xms16m -Xmx80m -XX:+UseSerialGC -Xss512k |
| Frameworks | Javalin 7.2.3; Spring Boot 4.1.1 |
| Persistence | H2 2.4.240, persistent file storage; 4 MiB cache setting |
| Connection pool | HikariCP 7.0.2; 1 minimum idle / 2 maximum connections |
| Monitoring | StatLite 0.6.0; 30-second polling |
| Workload | Five minutes, 5 requests/second, 1,500 scheduled requests |
The API serves latest quotes, reads quote history and accepts transactional three-row quote batches. The request mix is 80% reads and 20% writes, with at most four requests outstanding. That is a plausible workload for a small internal tool or personal API, although a deterministic fixture cannot represent every application's traffic.
The 256 MiB allocation is intentionally constrained. It makes the cost of persistence, the Java runtime and monitoring visible together. The heap ceiling is only part of that budget: Java also needs memory outside its heap, and Linux and StatLite need their own share.
I smoke-tested both deployments inside Alpine before measuring. Each recorded run began after a guest reset, with fresh database and monitoring storage. StatLite settled for 90 seconds before Java launched. Before Java startup, StatLite’s median RSS was approximately 14 MiB in both runs. This is separate from the reported Java RSS, but contributes to overall guest memory usage. Startup was followed by three minutes idle, five minutes of traffic and two minutes of recovery. Independent OS sampling recorded memory and paging, while an external HTTP generator checked responses and latency. The methodology records the full contract and thresholds.
Equivalent applications, different frameworks
Both applications use the same business logic in Quotes.java, JDBC queries and transactions, database schema and seed fixture, API routes and response contract. They also share JVM settings, workload and final expected database state. Each begins with 1,170 seeded rows and should finish with 2,070 rows, maximum sequence 689 and a price sum of 630374.22.
| Aspect | Javalin | Spring Boot |
|---|---|---|
| Web server | Embedded Jetty | Embedded Tomcat |
| HTTP handlers | Explicit Javalin routes | Spring MVC controllers |
| Server threads | Normal Jetty defaults | 16 maximum, 2 minimum spare Tomcat workers |
| Monitoring | Micrometer plus StatLite adapter | Standard Actuator and Micrometer |
| Packaging | Shaded executable JAR | Official efficient extracted JAR |
Javalin exposes HTTP and JVM metrics through Micrometer and a small adapter, following the Javalin integration guide; Spring Boot uses Actuator. StatLite collects both, while the independent OS sampler records resident memory and paging.
These are functionally equivalent applications with different framework infrastructure. They do not have identical runtime implementations, framework capabilities or monitoring overhead. Spring's extracted layout was prepared outside the measured VM and launched with the same JVM flags.
Results: Startup, memory, and latency
Both applications completed all 1,500 requests correctly. Final database checks matched the expected state. Javalin reached readiness in about 2.46 seconds; Spring took about 9.89 seconds. Startup includes schema creation, seeding and application readiness, with monitoring already running.
| Metric | Javalin | Spring Boot |
|---|---|---|
| Startup to readiness | 2.458 s | 9.893 s |
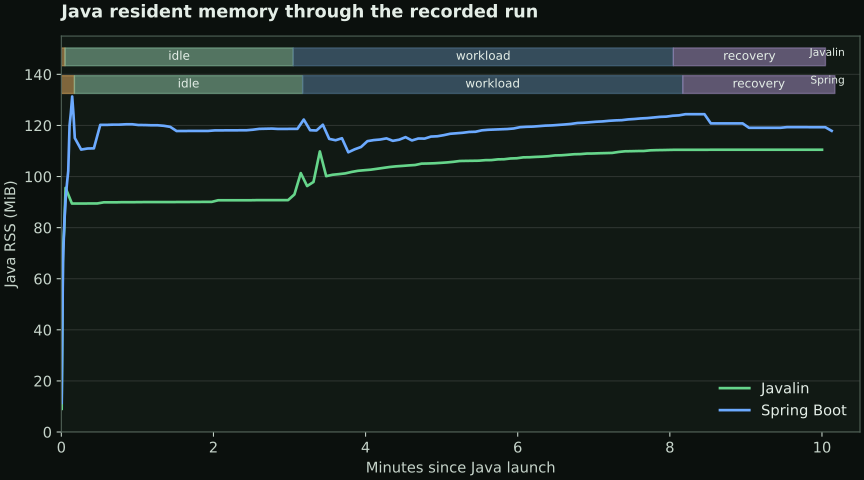
| Median idle RSS | 90.03 MiB | 118.63 MiB |
| Median load RSS | 106.43 MiB | 118.56 MiB |
| Median recovery RSS | 110.49 MiB | 119.35 MiB |
| Minimum settled RAM available | 69.76 MiB | 45.28 MiB |
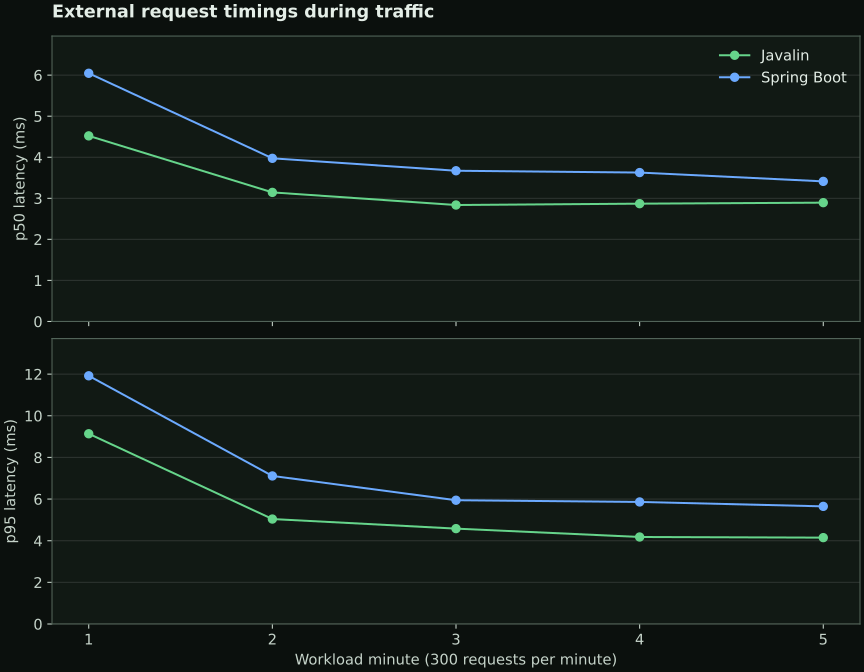
| HTTP p95 | 6.094 ms | 8.393 ms |
| HTTP maximum | 84.051 ms | 119.271 ms |
| Correct requests | 1,500 / 1,500 | 1,500 / 1,500 |
Javalin used less resident memory in every settled phase and left more available system RAM. Its load median was about 12 MiB below Spring's, and its minimum settled headroom was about 24.5 MiB higher. Recovery RSS remained above idle for both; returning to the initial footprint was not a requirement.
Both applications completed the workload, but memory pressure differed. The Javalin guest recorded 0.32 MiB of swap-in and no swap-out during traffic, compared with 27.23 MiB in and 31.77 MiB out for Spring Boot. This is additional context for the memory measurements, not evidence that either framework would behave the same way under different workloads.
HTTP latency was low for both at this request rate. Neither had workload errors or missed slots. These timings include the local SSH tunnel path, so they describe this setup rather than internet response times. They also say little about capacity at higher concurrency.
The Javalin analysis and Spring analysis preserve the phase measurements. The numbers support a practical footprint comparison for these applications, rather than a ranking of the frameworks' broader capabilities.
Dashboard history
These operator screenshots were captured after measurement, before monitoring stopped. Application memory is a JVM metric, not process RSS; dashboard average latency differs from the external request percentiles above. Click an image to inspect the original.
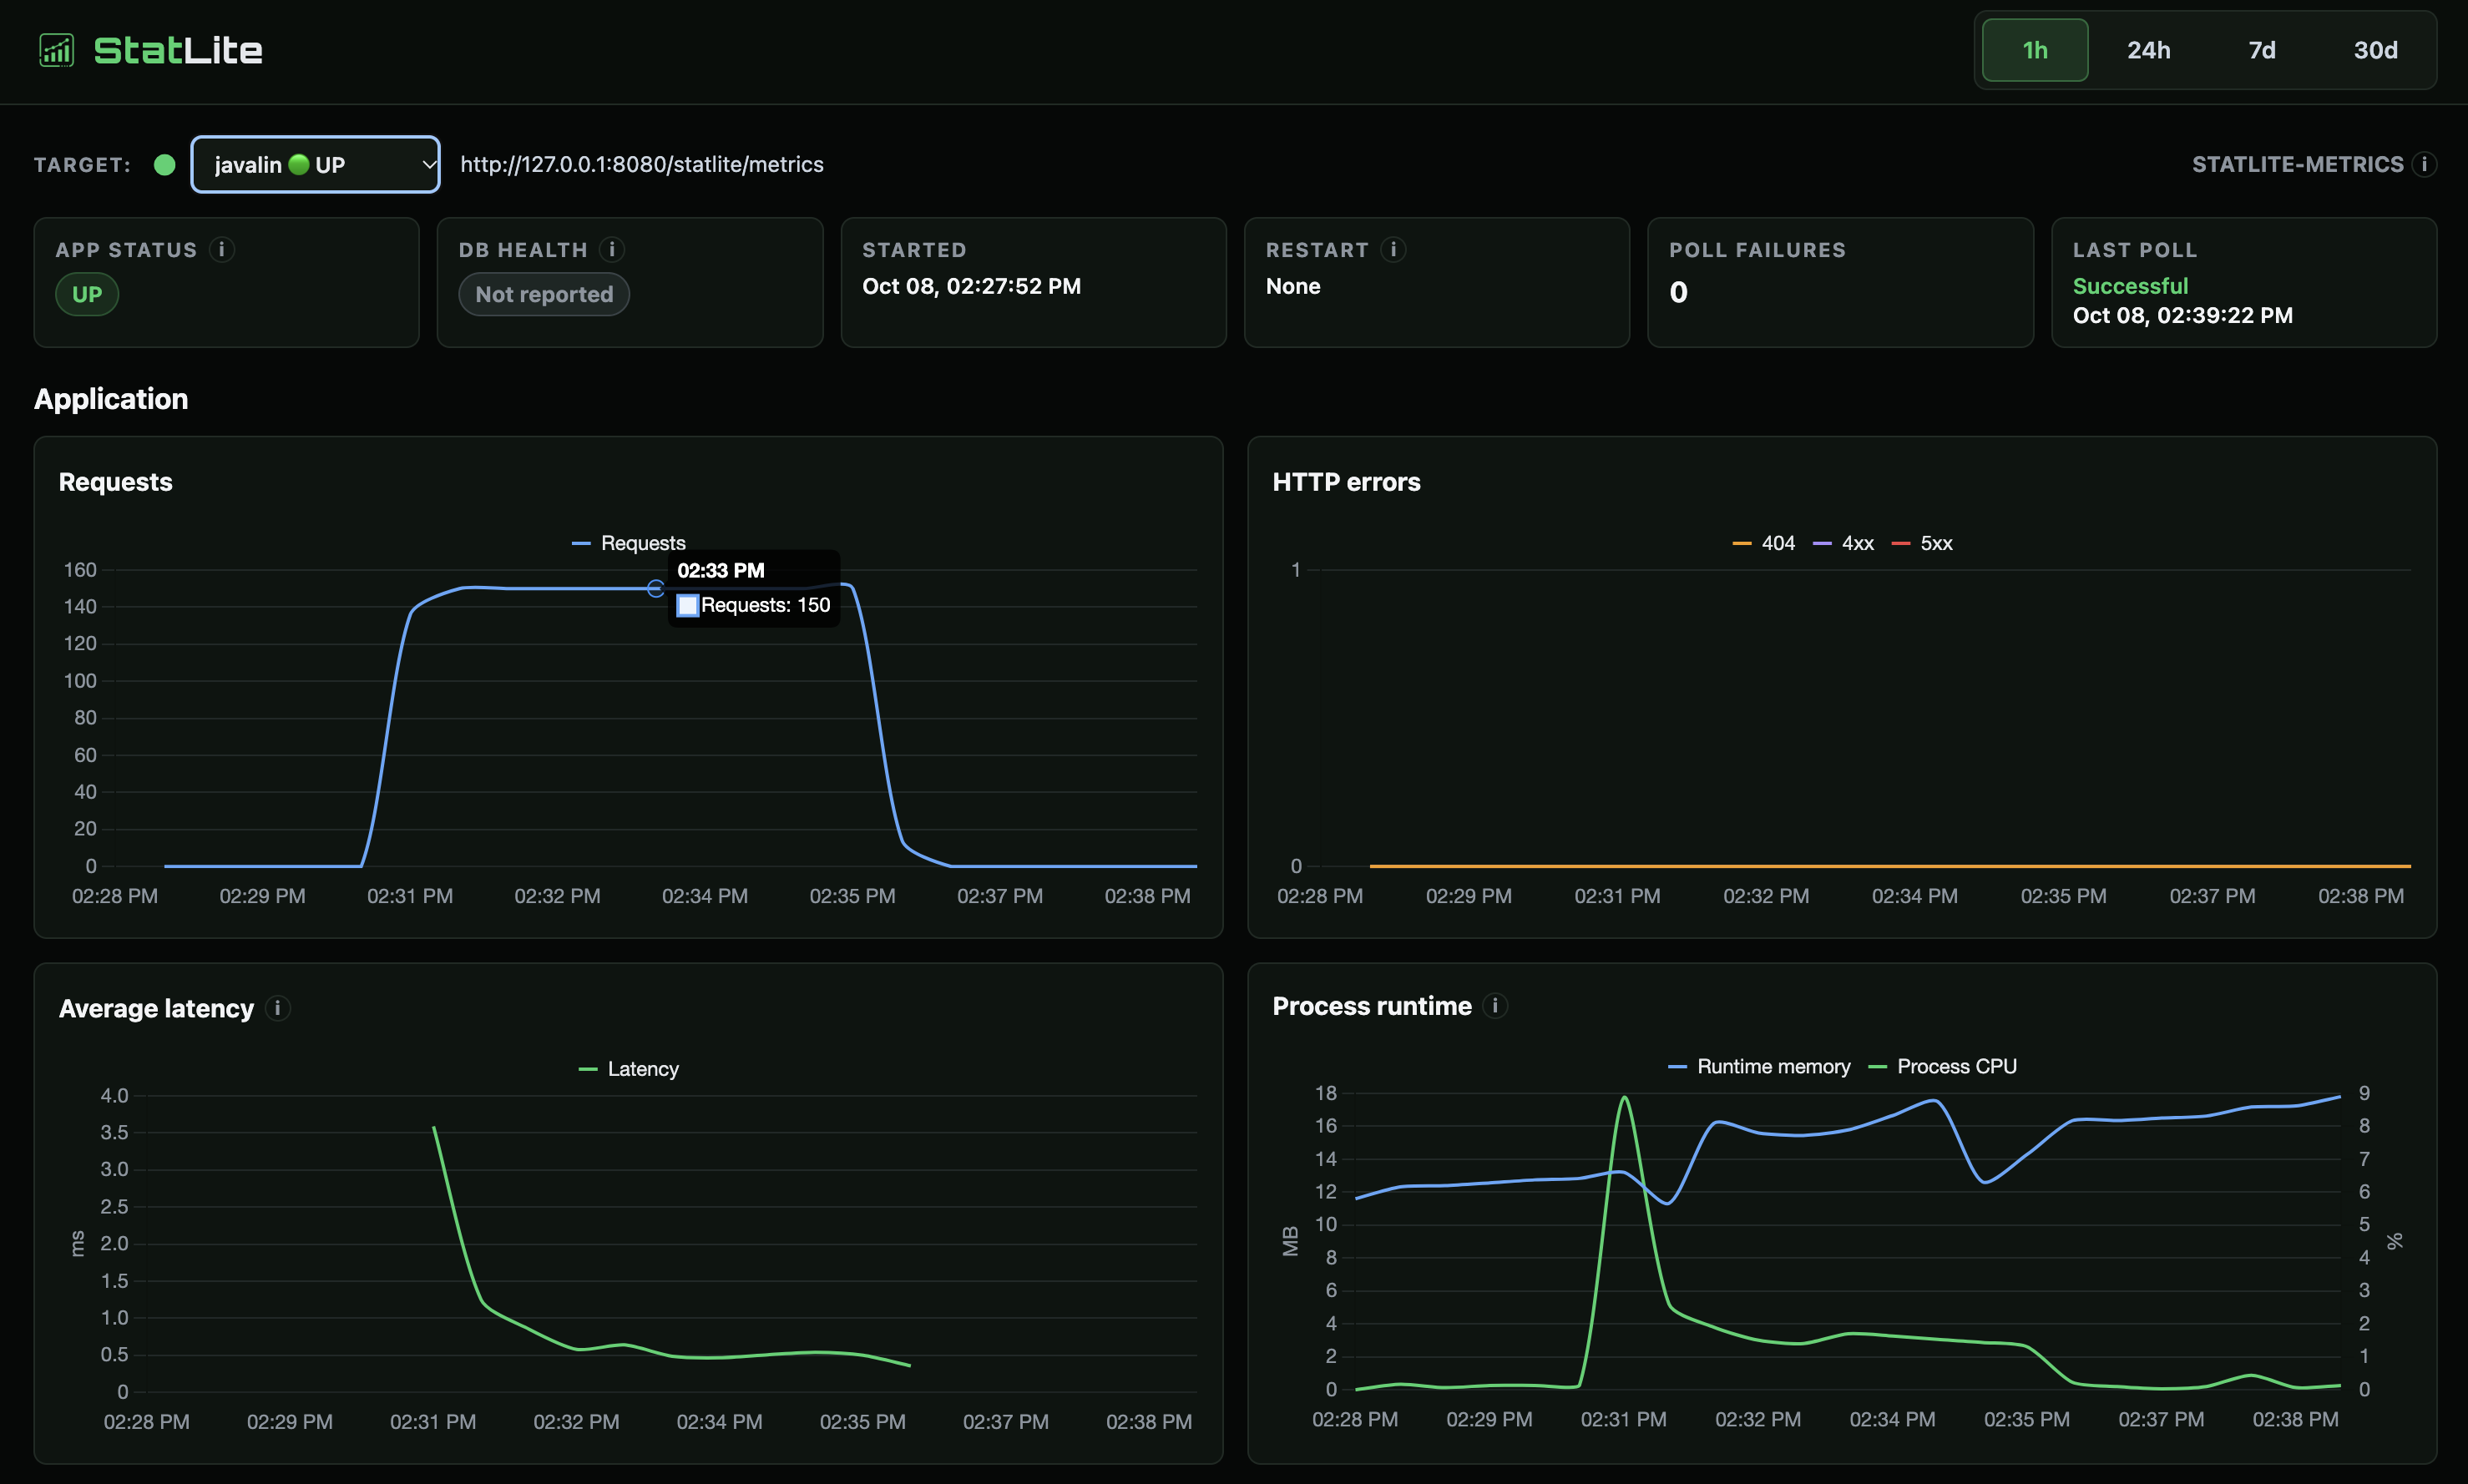
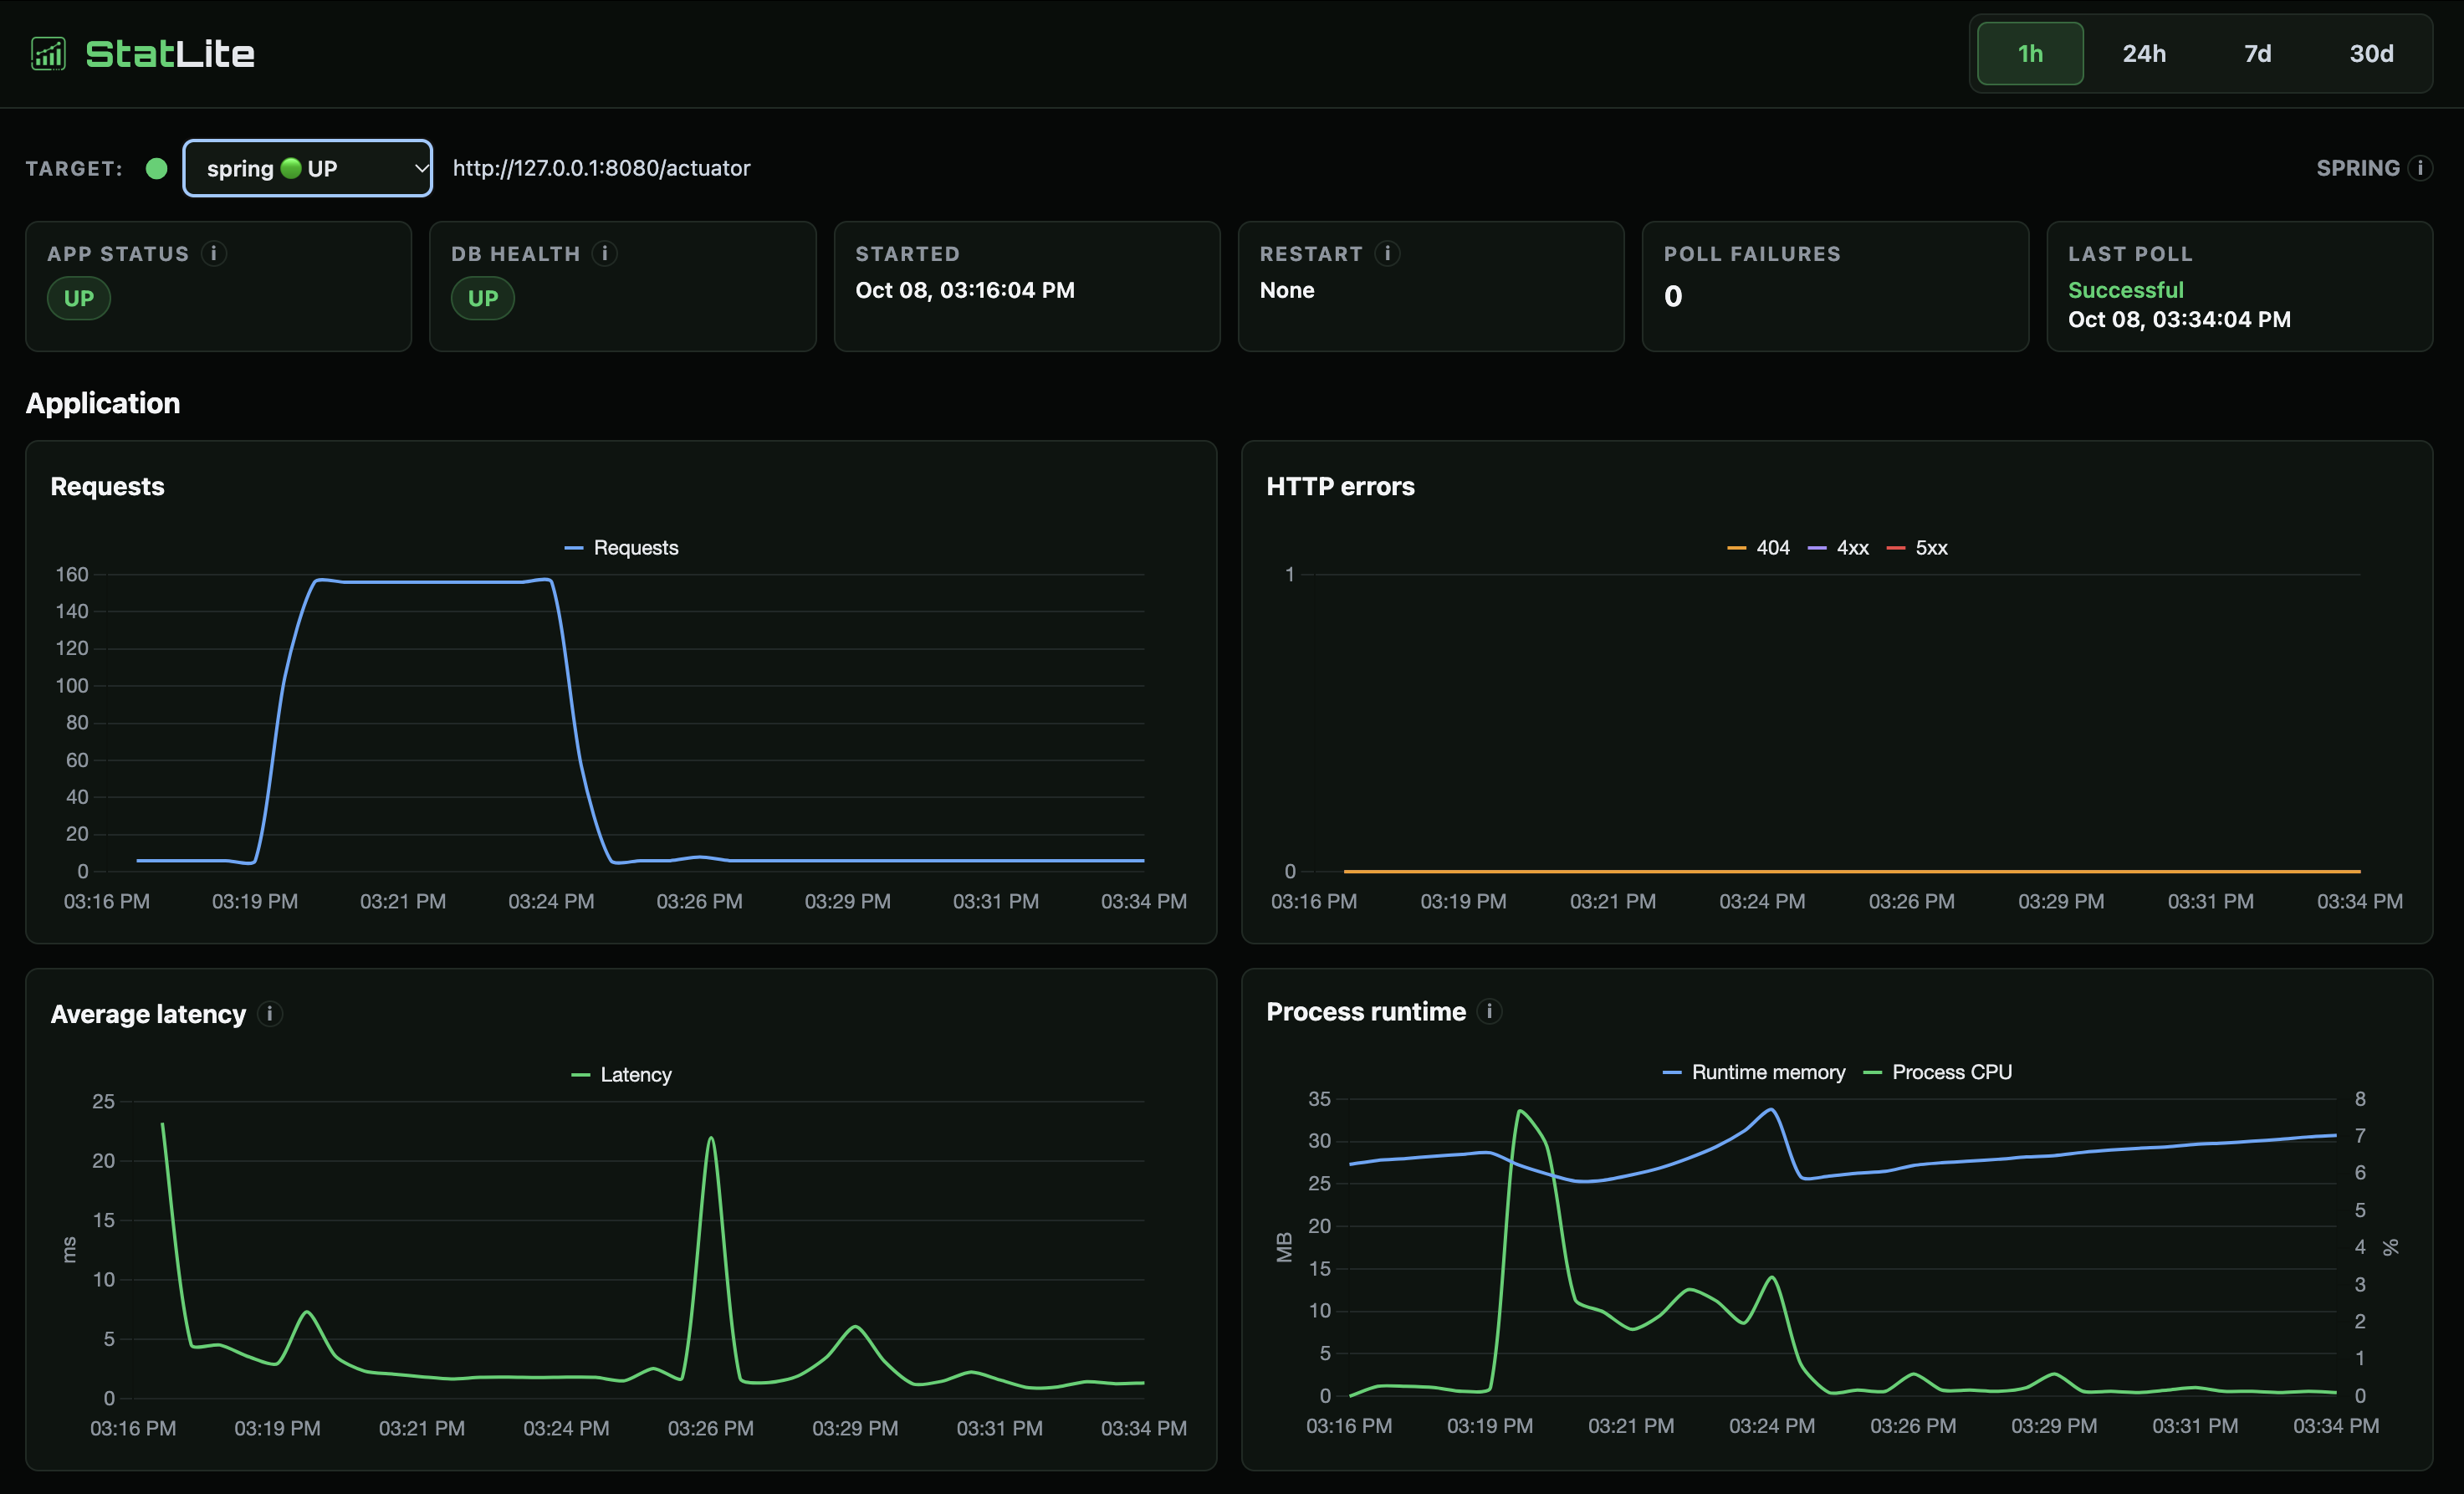
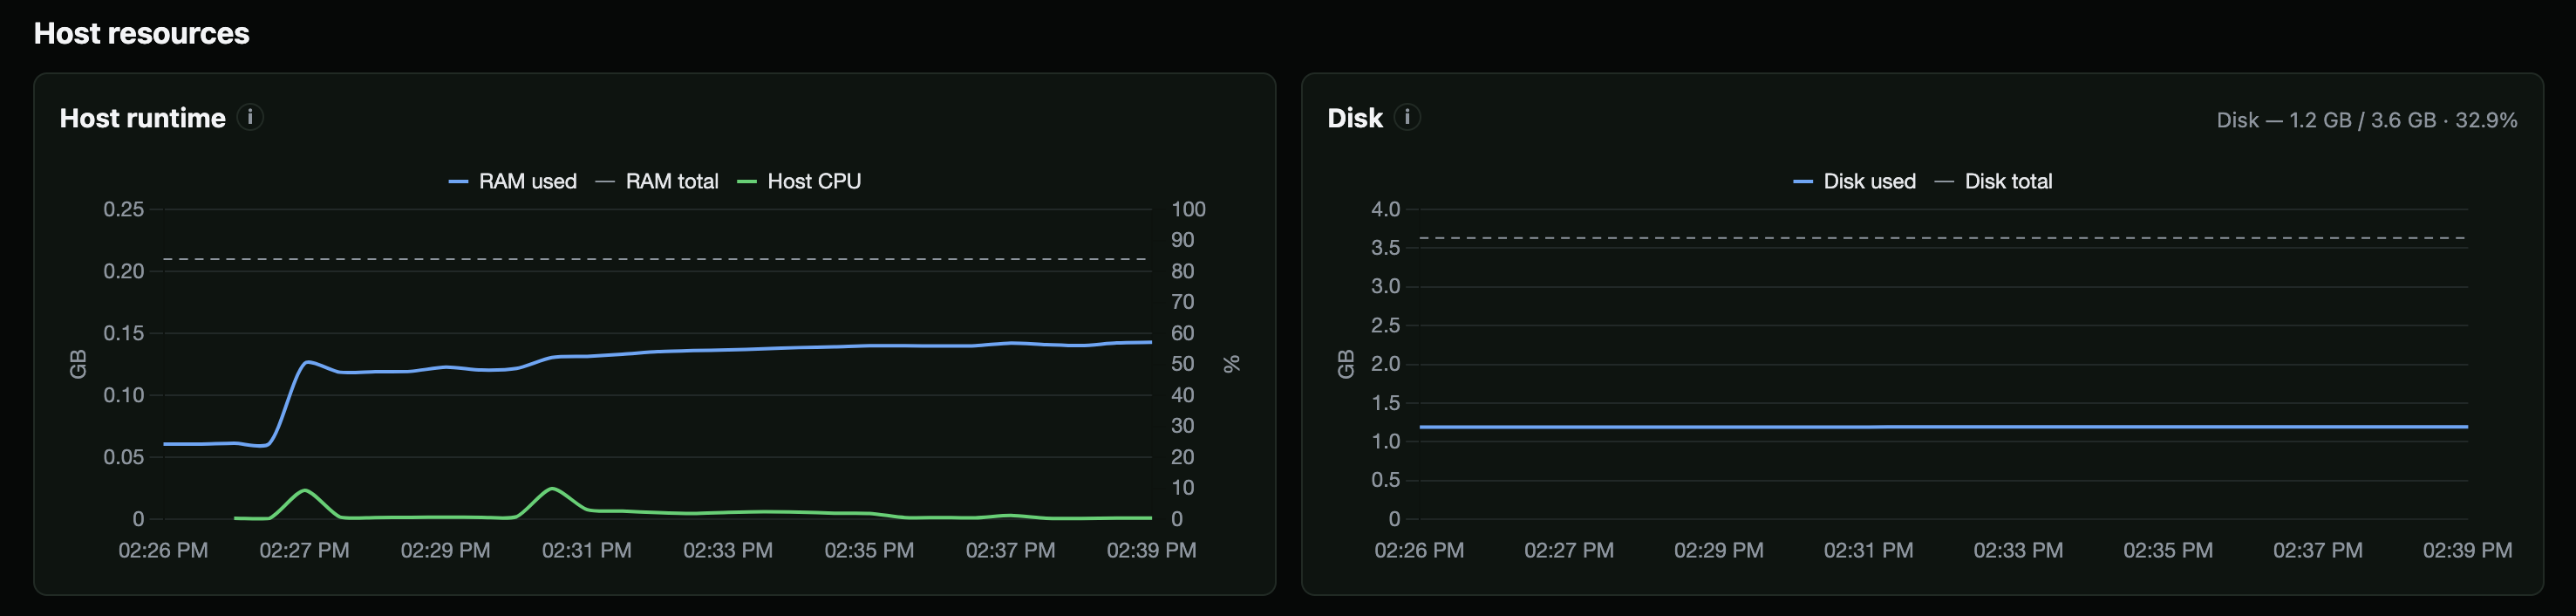
These dashboards were collected with StatLite, a lightweight, self-hosted monitor I develop at PVR Labs. If you'd like similar JVM and HTTP metrics history for your own application, StatLite supports both Spring Boot and Javalin.
Limitations and conclusion
There was one recorded run per implementation: Javalin first and Spring second. Traffic was small and deterministic, rather than a throughput or high-concurrency benchmark. The environment was an Alpine Lima VM with disk swap enabled, not a provider VPS. Web servers and monitoring integrations differed. Paging volumes use sampled endpoints; original Javalin CPU records lack steal-time data, limiting exact busy-CPU accounting.
The results do not establish production capacity, long-running leak behavior or suitability for complex application requirements. The method and execution notes and screenshot captions retain the evidence and qualifications.
Direct JDBC keeps this experiment’s persistence baseline explicit, but it is not always the most practical choice for application development. Application code must manage connections and statements, bind parameters, map rows, and handle transactions. A separate follow-up will compare Jdbi, MyBatis, and jOOQ in the same Javalin application, looking at implementation responsibilities alongside startup, memory, and package size. That experiment is complete and will be published separately.
As I expected, Javalin was noticeably lighter than Spring Boot in this experiment. It started faster, used less resident memory, and left more RAM available on the 256 MiB VM. Both applications handled the workload correctly.
But I wouldn't read these results as a reason to replace Spring Boot with Javalin. Spring Boot provides a lot out of the box, including dependency injection, configuration, health checks, and integrations with the broader Java ecosystem. With Javalin, you'll need to choose and assemble more of these pieces yourself when your application requires them.
For a small, focused application, I think that trade-off can make sense. For larger applications, Spring Boot's built-in functionality may easily justify its additional memory footprint. This experiment shows what you can save with a lightweight framework, not that a lightweight framework is always the better choice.
Sources
The public experiment package includes source, reproduction instructions, original OS and HTTP samples, final analyses and dashboard screenshots.