My earlier Java memory experiment compared two Spring Boot applications: one using Spring Data JPA/Hibernate, the other using Spring JDBC/JdbcTemplate. The JDBC implementation used approximately 90 MiB less memory.
The measurement was real for the applications I tested, but the implementations also differed in their data model and application code. The difference therefore could not be attributed solely to Hibernate.
So I built a follow-up experiment. This is not an exact rerun of the original setup. It is a new comparison designed to address that methodological objection, with a more useful control: Hibernate running directly in the same lightweight application infrastructure as Jdbi.
Three implementations, two different questions
I retained the original Spring Boot demo app as a reference, then implemented two lightweight versions with shared HTTP handling, rendering, polling logic and dashboard calculations.
| Variant | Application stack | Persistence |
|---|---|---|
| Spring Boot reference | Spring Boot 4.1.1, Thymeleaf | Spring Data JPA and Hibernate 7.4.5.Final |
| Lightweight SQL | CoilBase, Avaje Jex 3.6, JTE 3.2.4 | Jdbi 3.55.0, explicit SQL and mapping |
| Lightweight ORM | Same CoilBase/Jex/JTE application | Hibernate 7.4.5.Final, direct sessions and transactions |
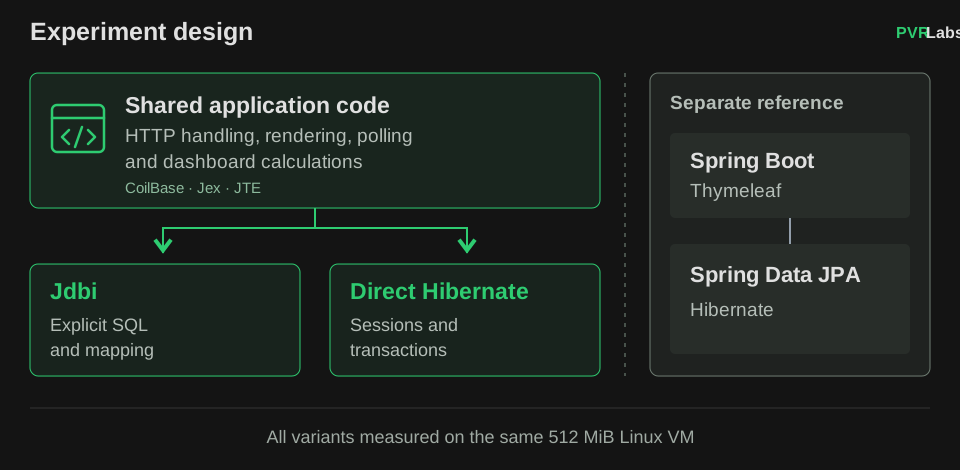
The Jdbi-versus-direct-Hibernate comparison is the main result. It holds the application infrastructure largely constant while changing the persistence implementation.
The goal isn't to reproduce every Hibernate feature with Jdbi, but to use only the persistence capabilities this application needs. For this demo app, explicit SQL is sufficient.
Comparisons with Spring Boot remain useful complete-stack measurements, but they cannot isolate the cost of Spring Boot, Spring Data JPA, the web server or the template engine.
Hibernate is used without Spring or Spring Data repositories in the lightweight ORM variant. The Jdbi variant has no Hibernate runtime dependency. The Hibernate variant retains transitive Jdbi libraries through CoilBase, but checks confirmed that an unused Jdbi repository context was not initialized. Retained dependencies are disclosed, not assumed to have zero cost.
Disclosure: I am the author of CoilBase, a lightweight Java foundation that keeps SQL explicit and business logic portable across frameworks.
What stayed equivalent
The demo app polls GitHub repositories, records their star-count histories and renders a dashboard. The significant behavior includes ETags and 304 responses, per-repository transactions, failure isolation, updates to polling and pushed timestamps, and history records only when star counts change.
The two lightweight implementations share the polling and presentation code. All three variants passed packaged HTTP contracts, restart checks and offline database verification. The measured harness independently validated committed project and history data against the commanded fixture generations.
This demonstrates the tested behavior, not identical internal work. For example, the original-workload monitoring endpoints differ between Spring Boot and Jex.
Environment and workload
I used a dedicated Ubuntu 24.04 QEMU/KVM VM with 1 vCPU, 512 MiB allocated RAM and no swap, running Temurin JDK 25.0.5. Every variant used embedded, file-backed H2 2.4.240, HikariCP with a maximum of four connections, and identical JVM flags, including -Xmx80m and Serial GC. Embedded H2 memory is included in application process RSS.
I measured an original short workload and a longer mixed read/write workload, each with two accepted runs per variant and reversed execution order for the second repetition. The extended workload comprised 60 seconds idle, 120 seconds warmup, 300 seconds of paced reads and refresh writes, and 60 seconds recovery.
The following RSS/PSS numbers are ranges of per-run median process memory during the extended mixed phase, not peak memory or independent per-second repetitions.
Measured results
Both workloads passed acceptance, but I focus on the extended mixed workload here because it includes sustained reads and writes. The original short-workload measurements remain available in the public experiment record.


Chart labels name the HTTP and persistence stacks: Jex + Jdbi and Jex + Hibernate share the CoilBase application; Spring Boot + JPA uses Spring Data JPA and Hibernate. Startup and latency labels show the two accepted runs, with bars at their midpoints. RSS labels show the two mixed-phase medians, including embedded H2; bars show their midpoints. These ranges are not confidence intervals. The accepted Hibernate rerun used different background timer settings. JAR sizes sum deployed JAR files and exclude other deployment files.
| Measurement | CoilBase + Jdbi | CoilBase + direct Hibernate | Spring Boot + Spring Data JPA |
|---|---|---|---|
| Mixed-phase RSS | 95.2–96.4 MiB | 151.8–153.6 MiB | 235.7–235.8 MiB |
| Mixed-phase PSS | 92.8–94.0 MiB | 149.3–151.2 MiB | 233.4–233.5 MiB |
| Startup | 1.05–1.16 s | 2.31–2.32 s | 6.80–7.10 s |
| Dashboard p50 | 4.4 ms | 7.9 ms | 12.3–12.4 ms |
| Dashboard p95 | 7.7–7.9 ms | 15.1–15.6 ms | 29.5–31.1 ms |
| Sum of deployed JAR files | 6.8 MiB | 27.7 MiB | 58.2 MiB |
Jdbi's deployed JARs total 6.8 MiB versus 27.7 MiB for direct Hibernate, a difference of approximately 20.9 MiB.
The Jdbi implementation used approximately 55–58 MiB less process RSS than direct Hibernate under the mixed workload, or approximately 37% less RSS.
That difference persists even after excluding Spring Data JPA from the Hibernate implementation. It is the central finding. It does not isolate the memory used by the Hibernate library: these are complete application processes running different persistence implementations, including their initialization and database interactions.
The Spring Boot reference consumed about 236 MiB. The additional roughly 83 MiB compared with lightweight direct Hibernate cannot be attributed specifically to Spring Data JPA because the surrounding application stacks also differ.
Dashboard request latencies followed the same ordering, but this is a paced, single-vCPU workload, not a maximum-throughput test or a general ORM ranking.
Why SQL counts deserve a separate look
Cumulative H2 statistics reported approximately 2,790 executions for each lightweight implementation and 1,894 for Spring. The first runs also recorded 1,088 COMMIT statements for the lightweight applications versus 186 for Spring.
These are database engine counts, including bootstrap, diagnostics and transactions, not network roundtrips. They do not establish which approach is inherently more SQL-efficient. Transaction boundaries and differences in diagnostic work need to be understood before explaining the discrepancy.
One rejected run
All six original-workload runs passed automated acceptance. One extended Hibernate attempt was killed by the guest OOM killer during the mixed phase. A firmware refresh timer started shortly beforehand, and the firmware service appeared in the OOM evidence. This establishes a temporal correlation, not the cause of the memory pressure.
I retained the failed run and repeated only that case after disabling automatic-update and firmware-refresh timers in the dedicated VM. The rerun passed with unchanged application artifact, JVM flags and workload. There are twelve accepted runs in total, but the replacement Hibernate measurement had different background conditions. Small differences between its two accepted readings should not be interpreted as meaningful.
Both accepted Hibernate runs completed the extended workload within the 512 MiB VM. The rejected attempt demonstrates that this configuration can still encounter memory pressure under different guest conditions.
There were only two accepted runs per variant and mode. Each mixed phase included 300 dashboard requests and 30 refresh requests, so refresh tail-latency statistics are particularly limited.
What I learned
Hibernate has capabilities that are worth paying for: managed entities, dirty checking, relationship mapping and a mature object-oriented persistence model. Those conveniences can save application code and development time.
Jdbi keeps SQL, row mapping and query behavior visible. For this small backend, that was a workable choice and used less memory in the controlled lightweight-stack comparison. The price is owning more of the SQL, mapping and loading decisions directly.
This experiment does not suggest that existing Spring Boot applications should generally be migrated, or that Hibernate is an unreasonable default. The earlier comparison established a difference between application implementations. This follow-up supports a narrower conclusion: with substantially the same lightweight HTTP and application code, the direct Hibernate implementation used materially more memory than the Jdbi implementation for this demo app under these conditions.
For a memory-constrained Java service, that difference can matter. For a larger application, the benefits of Hibernate and Spring Data JPA may justify their costs.