An early RSS reading suggested OpenJ9 was heavier than HotSpot; later, settled measurements showed the opposite for CoilBase. How do the two JVMs behave across applications on a tiny VM? I ran two Java 25 quote APIs on a 256 MiB Debian guest. This is a short exploratory capture, not a benchmark.
After my earlier Java memory experiments, several readers suggested including Eclipse OpenJ9. I’m also considering it for upcoming comparisons across JVMs and Java frameworks, so I wanted to start with a small exploratory run to understand its memory and startup behavior before committing to a larger experiment.
Setup
The local Lima VM had one vCPU, 256 MiB allocated RAM (211 MiB guest MemTotal), a 6 GiB disk and a 512 MiB swapfile. I used Temurin 25.0.5+8 (HotSpot) and IBM Semeru Open Edition 25.0.5.0 (OpenJ9 0.63.0), both with -Xms16m -Xmx80m -Xss512k and no explicit collector. The applications were Spring Boot 4.1.1 with Spring JDBC, a familiar baseline, and CoilBase, a lightweight Java foundation I developed to retain Spring-like application patterns with less framework overhead. CoilBase uses Avaje Jex and Jdbi. Both applications expose the same quote API and use file-backed H2 inside the process. Using both helps explore whether JVM memory behavior depends on application footprint.
Before each run I reset swap and dropped the page cache; the guest was not rebooted. After readiness, each phase had nine samples, five seconds apart, over about 45 seconds. The load phase used a read-only endpoint at about 4.5 requests per second; all 198 to 206 requests per run succeeded. The warm Semeru CoilBase run covered idle only.
Results
Memory figures are MiB, medians of nine samples. Ready is the one-second poll count until the first successful read. RSS and swap are the JVM process's VmRSS and VmSwap; available is guest-wide MemAvailable.
| Run | Ready (s) | Idle RSS | Idle swap | Idle available | Load RSS | Load swap |
|---|---|---|---|---|---|---|
| Temurin CoilBase | 3 | 90.6 | 0 | 62.7 | 92.8 | 0 |
| Semeru CoilBase, cold | 8 | 74.9 | 4.6 | 102.3 | 81.1 | 8.8 |
| Semeru CoilBase, warm | 3 | 73.7 | 0 | 90.1 | — | — |
| Temurin Spring | 10 | 126.6 | 58.2 | 37.9 | 118.6 | 70.6 |
| Semeru Spring, cold | 21 | 88.5 | 14.8 | 86.8 | 121.9 | 19.4 |
Early RSS can change the apparent ranking
A separate initial smoke observation at first successful request showed Semeru CoilBase at 100.1 MiB and Temurin at 89.3 MiB. The smoke had no swap reset and is not directly comparable to the later capture. In the later cold Semeru capture, RSS was 97.2 MiB at the first sample, 102.2 MiB at five seconds, and roughly 70 to 77 MiB for the remaining idle samples. Its nine-sample median was 74.9 MiB versus Temurin's 90.6 MiB.
Memory behavior differed by application and workload
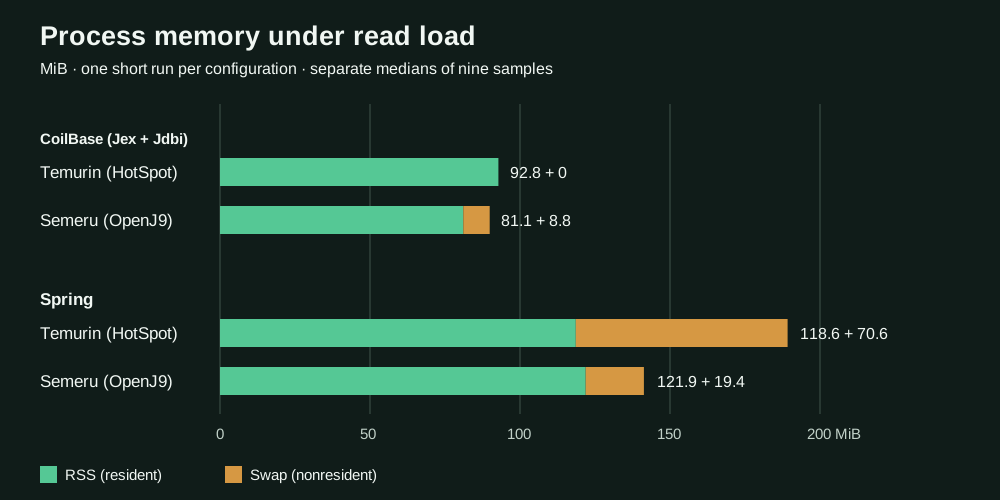
Under load, CoilBase on Temurin had 92.8 MiB RSS and no swap; Semeru had 81.1 MiB RSS and 8.8 MiB swap. Summing the separate medians gives 92.8 and 89.9 MiB, a 2.9 MiB difference. For Spring, the corresponding sums were 189.2 MiB (118.6 RSS and 70.6 swap) and 141.3 MiB (121.9 RSS and 19.4 swap). The difference was much larger for Spring in this capture.
RSS represents resident pages; swapped pages are nonresident. These sums are rough accounting indicators, not exact process footprints or unique physical RAM consumption. The CoilBase and Spring comparison includes differences across their application stacks, so it does not isolate framework overhead. Guest MemAvailable is a separate measure of system pressure: at idle it was 62.7 MiB for Temurin CoilBase and 102.3 MiB for cold Semeru CoilBase.
Cold and warm startup
Cold Semeru readiness was about 8 seconds for CoilBase and 21 seconds for Spring, compared with 3 and 10 seconds for Temurin. A second Semeru CoilBase run reused the 22 MiB shared class cache and reached readiness in about 3 seconds, matching Temurin. Cache reuse is a plausible contributor, but this single observation does not isolate its effect. Spring's cache occupied 43 MiB on disk.
Limits
There was one run per configuration, no guest reboot between runs, and a short, light, read-only workload. Readiness was measured coarsely. The measured processes did not record collector behavior; a separate Temurin process selected Serial GC. Swap activity was not evaluated for its effect on request latency. The shared class caches consume disk space. These observations do not establish a general runtime ranking.
The earlier Alpine experiment used the same packaged apps with HotSpot, a different guest and a longer method.
Takeaway
OpenJ9 showed lower settled idle RSS in this capture, while the under-load difference depended on the application and swap. Cold startup was slower; one warm CoilBase run matched HotSpot’s observed readiness. A single RSS sample can be misleading, especially early in a run.
Sources
The public experiment record includes the method and recorded measurements.