I wanted to know whether a representative Spring Boot application could share a nominal 256 MiB VPS with a small monitoring service. I started with Alpine Linux and JDK 21. That baseline was too tight: severe GC and paging pressure eventually made Spring stop responding.
A separate follow-up changed the runtime to JDK 25, raised the heap ceiling to 80 MiB, limited compilation to C1, capped the code cache at 32 MiB, and enabled compact object headers. That configuration completed the full one-hour observation.
Update, September 30, 2026: Oracle JDK 27, released September 15, enables Compact Object Headers by default. This experiment used JDK 25, where they were disabled by default and explicitly enabled with -XX:+UseCompactObjectHeaders. I have not rerun this 256 MiB experiment on JDK 27, so the measurements below remain JDK 25-specific.
What I was trying to run
Star Pulse uses Spring Boot 3.5.5, Spring MVC, embedded Tomcat, JPA, Hibernate, file-backed H2, Actuator, scheduled GitHub polling, and outbound HTTP. StatLite monitored the Spring application and itself.
The test used Alpine Linux 3.24.1 on one vCPU. The TierHive VPS was sold as a nominal 256 MiB plan, but the guest exposed about 216.9 MiB. A 512 MiB swapfile was enabled before the runtime and services were started. Signup and free credits covered the experiment. The TierHive link is an affiliate link; I may earn a commission if you sign up. This result reflects this specific test and is not a provider-wide performance claim.
The public experiment snapshot contains the demo application, the Alpine deployment kit, exact runtime identities, and a curated result summary. The full execution diary and raw checkpoints remain private.
Why the JDK 21 run was not good enough
The preserved combined JDK 21 result used a 64 MiB heap. That was too aggressive for this workload. It produced severe GC pressure, long pauses, heavy paging, and periods where Spring stopped responding.
An 80 MiB JDK 21 reading was observed live, but no standalone result was preserved. I am not treating it as a traceable JDK 21 comparison point. The documented JDK 21/64 MiB run did not achieve a clean one-hour Spring plus StatLite observation.
On a machine this small, making the Java heap smaller can make the whole system worse.
The 64 MiB result is an unsuccessful tuning step. I did not build a large JVM tuning matrix. The next follow-up was the JDK 25 configuration.
The JDK 25 configuration
The final Spring command used:
-Xms16m
-Xmx80m
-Xss256k
-XX:+UseSerialGC
-XX:TieredStopAtLevel=1
-XX:ReservedCodeCacheSize=32m
-XX:+UseCompactObjectHeaders
-XX:+UseCompactObjectHeaders is a JDK 25 product flag that reduces object headers from 96 bits to 64 bits on 64-bit architectures. Compact headers are disabled by default in JDK 25, so I explicitly enabled them for this run. In JDK 27 they are enabled by default, so that flag is no longer required for the default configuration. I did not measure compact headers in isolation.
What changed
The traceable startup comparison is not perfectly like-for-like. The earlier documented Alpine JDK 21 run used a 64 MiB heap; the final JDK 25 run used 80 MiB, C1-only compilation, a 32 MiB code-cache ceiling, and compact object headers.
| JDK 21 documented follow-up | JDK 25 final run | |
|---|---|---|
| Heap ceiling | 64 MiB | 80 MiB |
| C1 / 32 MiB code cache | yes | yes |
| Compact object headers | no | yes |
| Spring startup | 163.156s | 73.405s |
| Combined one-hour run | not achieved | completed |
| Final Spring RSS | n/a | ~86 MiB |
| Final StatLite RSS | n/a | ~10 MiB |
| Final combined RSS | n/a | ~96 MiB |
| Final swap | n/a | 184 MiB |
The one-hour result
The JDK 25 configuration completed the full one-hour combined observation with both services still running:
- no OOM kills;
- no service restarts;
- all 72 bounded HTTP requests returned HTTP 200;
- StatLite polling continued for both targets;
- Spring’s scheduled GitHub polling continued after one early EOF/retry event;
- final Spring RSS: 87,616 KiB;
- final StatLite RSS: 10,196 KiB;
- final combined RSS: 97,820 KiB; and
- final swap use: 184 MiB of 511 MiB.
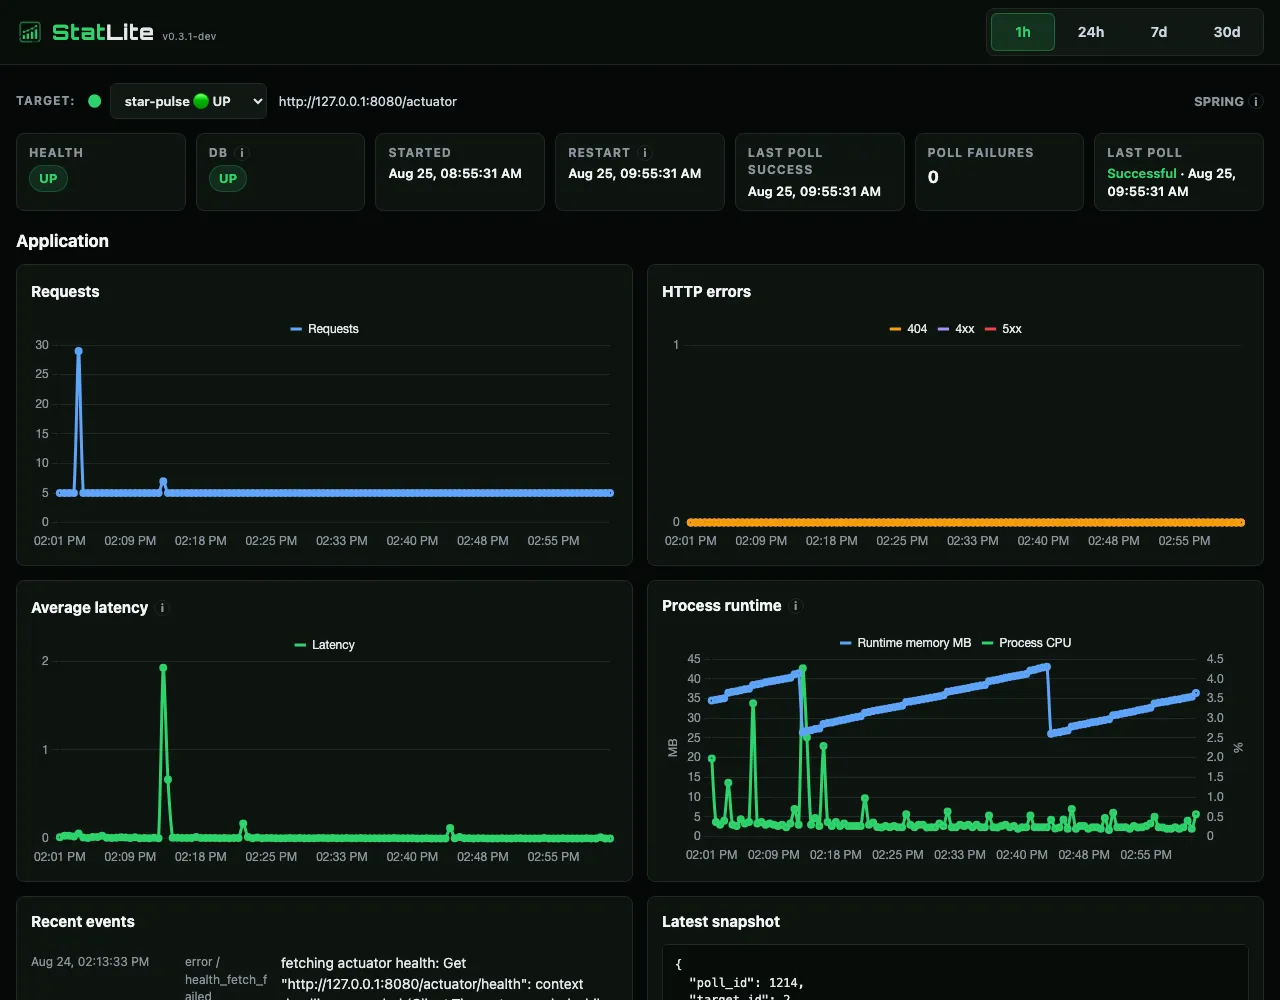
Want this visibility on a small VPS? StatLite is the lightweight monitor used beside Star Pulse here. It turns Spring Boot Actuator into local history and charts for health, requests, errors, latency, memory, CPU, uptime, and restarts. Star it to bookmark the project and help other Spring Boot developers find it.
Hikari also logged “Thread starvation or clock leap detected” with a housekeeper delay of about 2 minutes 13 seconds. I do not know whether paging, JVM pressure, scheduling, or a clock event caused it.
StatLite stayed around 10 MiB at the final checkpoint and kept polling both targets.
What I did not isolate
I did not isolate every JDK 25 change, and I have no separate heap-savings number for compact object headers. The comparison is JDK 21 versus JDK 25, with a different heap ceiling and several constrained-runtime settings.
Does this mean I recommend 256 MB?
No. The hour finished, but the guest ended with 184 MiB of swap in use and an unresolved Hikari housekeeper delay of about two minutes. I would still start a real deployment at 512 MB RAM with a modest swapfile.
A later experiment reused this constrained JDK 25 JVM profile and compared fat JAR versus extracted layout under a controlled local workload. Extracted Spring Boot started faster; memory and swap did not show a material winner. Read the fat JAR vs extracted layout comparison.
What about JDK 27?
JDK 27 enables Compact Object Headers by default. That removes one explicit tuning flag from this JDK 25 configuration, but it does not reproduce the experiment on JDK 27.
I would still use 512 MiB as the practical starting point for this type of Spring Boot deployment until a comparable JDK 27 run shows otherwise.
Source
The method, demo, deployment kit, and selected measurements are in the public experiment snapshot. Star Pulse is included in the experiment tree. StatLite is the monitoring dashboard shown in the screenshots: a single Go binary using SQLite and Spring Boot Actuator. The snapshot also records the precise Alpine package, Java, and StatLite identities used for the preserved run.
Running Spring Boot on a small VPS? StatLite gives you monitoring without adding another heavyweight stack.