I wanted a straight answer for a cheap VPS: can a representative Spring Boot app live on 512 MB, and is there room left for something that actually watches it?
The result: 256 MB was too tight for this application. At 512 MB RAM plus a 256 MB swapfile, Spring Boot and StatLite completed the hour with zero restarts. StatLite ended at about 12 MiB RSS.
Spring Boot is not tiny. I did not try to make it tiny. The interesting result was that the monitor remained useful under memory pressure. In the successful run, StatLite ended around 12 MiB RSS while continuously polling both targets. In the separate no-swap test, Spring was OOM-killed and restarted while StatLite stayed up.
The setup that completed a clean hour was 512 MB RAM plus a 256 MB swapfile, with this JVM profile:
-Xms16m -Xmx64m -Xss256k -XX:+UseSerialGC-Xmx64m is not a 64 MB process. At the end of that hour Spring RSS was about 167 MiB. The heap series in the dashboard sat around 40 to 50 MB. Both are true. They measure different things.
What I ran
Star Pulse is a Java 21 / Spring Boot 3.5.5 service with JPA, Hibernate, file-backed H2, embedded Tomcat, Actuator, a scheduler, and outbound HTTP to GitHub. It tracks star counts for a few repositories. I could have skipped Hibernate. Then I would have been measuring a different app.
The guest was Ubuntu 24.04, 1 vCPU, 5 GB disk. Spring and StatLite ran as separate systemd units on loopback. The 512 MB VM showed about 452 MiB of usable RAM. StatLite polled Spring and itself every 30 seconds.
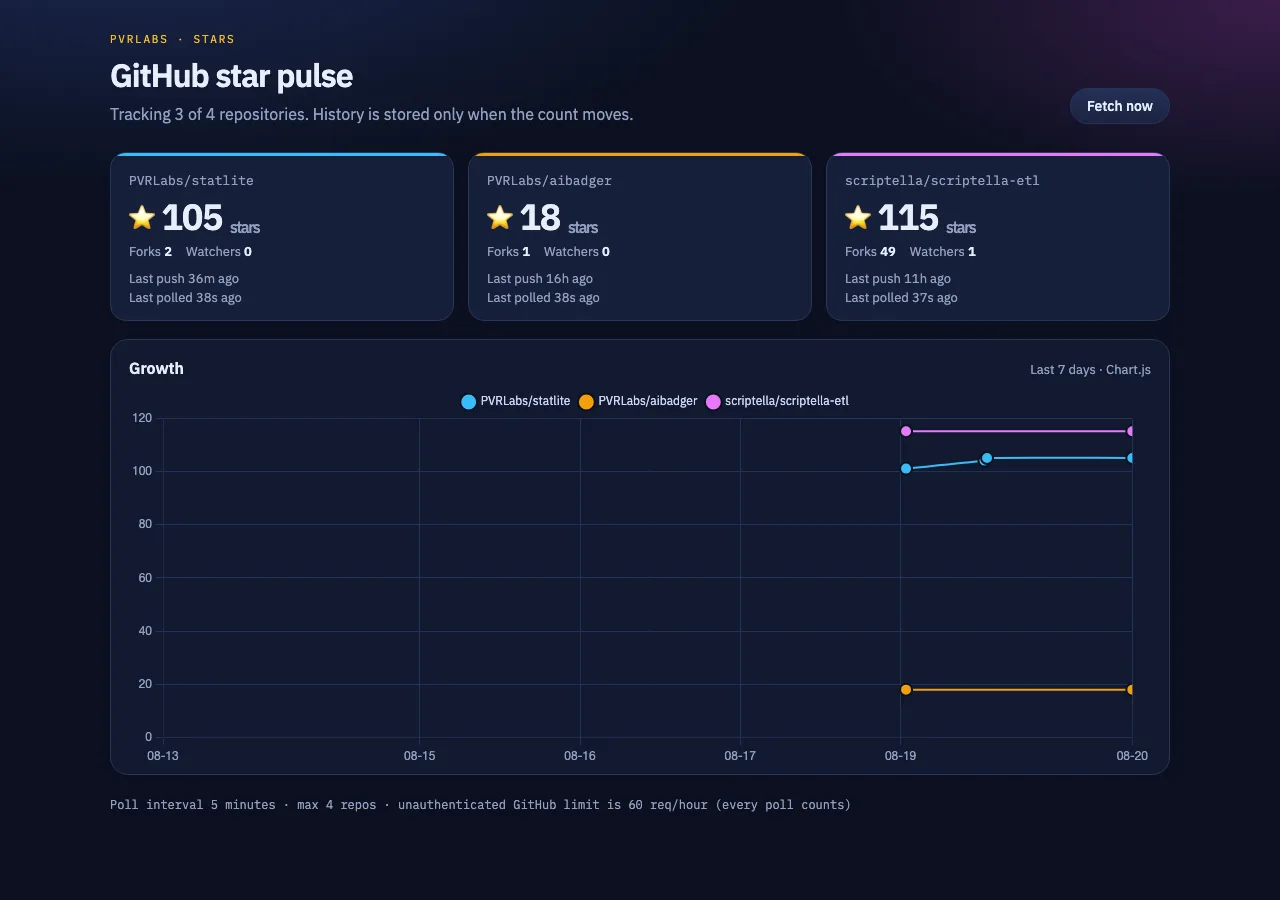
Once both services had settled, I watched them for 60 minutes and sent 72 bounded HTTP requests, 12 to each of six Spring and StatLite endpoints. If Spring or StatLite was OOM-killed, crashed, restarted, or never became usable, I did not call the run clean. Sitting at high memory use was allowed. That is the point of a small machine.
I tried five configurations:
| Configuration | Result |
|---|---|
| 256 MB, no swap | OOM/restart loop, operationally unusable |
| 256 MB + 256 MB swap | Completed hour, but Spring OOM-restarted once and swap stayed effectively full |
| 256 MB + 256 MB swap, aggressive JVM limits | Failed startup with Metaspace allocation error |
| 512 MB, no swap | Completed hour, but Spring OOM-restarted once |
| 512 MB + 256 MB swap | Clean 60-minute run, zero restarts |
512 MB without swap was close
On 512 MB with no swap, the hour finished. All 72 requests returned 200. Spring still got OOM-killed in the first three minutes of the 60-minute observation window. The JVM had already been running before that window started. It restarted and then behaved. StatLite never restarted. Final RSS was 270,284 KiB for Spring and 5,300 KiB for StatLite.
That is a machine you can babysit. It is not one I would leave alone and call done.
512 MB plus a small swapfile
I kept the same app and the same JVM flags, and added a 256 MB swapfile (about 255 MiB usable). Spring reached health in 14 seconds. For the next hour:
- 0 restarts; 72/72 HTTP checks returned 200
- final RSS: ~167 MiB Spring + ~12 MiB StatLite
- ~160 MiB swap used, ~140 MiB RAM still available
- 240 StatLite polls across both targets
Checkpoints from that run. Restart counts are Spring first, then StatLite.
| Checkpoint | RAM available | Swap used | Spring RSS | StatLite RSS | Restarts |
|---|---|---|---|---|---|
| Start | 81 MiB | 37 MiB | 244,024 KiB | 13,128 KiB | 0 / 0 |
| +90 seconds | 109 MiB | 97 MiB | 202,532 KiB | 13,588 KiB | 0 / 0 |
| +3 minutes, after traffic | 106 MiB | 140 MiB | 211,944 KiB | 10,044 KiB | 0 / 0 |
| +60 minutes | 140 MiB | 160 MiB | 167,420 KiB | 12,556 KiB | 0 / 0 |
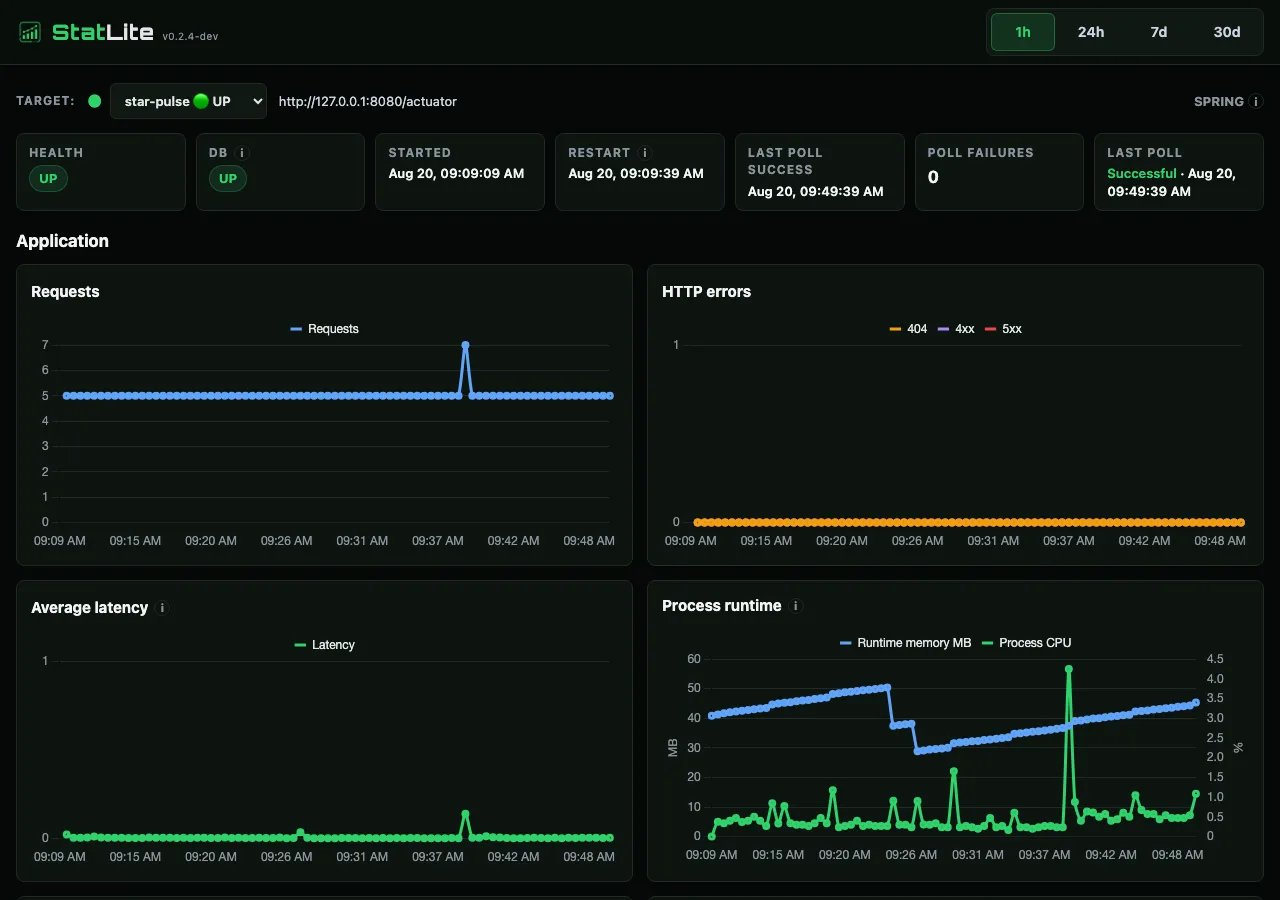
H2 stayed at 44 KiB. StatLite's SQLite file grew from 548 KiB at the start of the observation to 736 KiB at the end, with seven-day retention. The JVM used SerialGC and a 256k thread stack, but those settings did not make the process the size of the heap. Metaspace, thread stacks, direct memory, and mapped files sit outside -Xmx. If you size the VPS from the heap flag alone, that is usually why the OOM killer shows up.
The monitor did not go down with Spring
When Spring was OOM-killed on the no-swap 512 MB run, StatLite stayed up and kept polling. Health, restarts, and memory were still on the dashboard. On a box this small I want that process separate. If it dies with Spring, it cannot tell you Spring just died.
If a dashboard that small is useful on a box like this, star StatLite so other Spring Boot people can find it.
Spring Boot is not a 12 MiB service. Watching it does not have to mean standing up Prometheus and Grafana next to it.
Grafana's installation guidance lists 512 MB as the minimum recommended memory for the dashboard server itself, before adding a metrics backend such as Prometheus. That does not mean Grafana continuously consumes 512 MB RSS, but it shows why a conventional monitoring stack is an awkward fit when the entire VM has 512 MB.
Hosted tools such as New Relic or Datadog move storage and visualization elsewhere and are reasonable alternatives. StatLite makes a different tradeoff: Actuator metrics, collection, local SQLite history, and the dashboard stay on the machine, with no telemetry service required.
I left the box running after the hour. About 13 hours later both units were still active, still returning 200, still being polled. Swap was still in use. That is not a second timed run. It is just what it looked like the next day.
Don't copy this blindly
This is one app. Replacing embedded H2 with a database process such as MariaDB or Postgres on the same VPS will increase total memory pressure because that process needs its own memory. A separately hosted or managed database can move that pressure off this VM, but adds network and connection-pool considerations. More schedulers, larger pools, heavier starters, or a busier workload can also push local memory higher. I also would not size a fleet from one timed hour.
The smaller RAM rows above were a stretch test. I would not run this stack there. Checkpoints and method notes are in the public experiment repo.
A later follow-up completed a controlled hour on a nominal 256 MiB Alpine VPS with JDK 25 and 512 MiB of swap. It is a useful technical stretch result, not a replacement for the 512 MB recommendation. Read the JDK 25 / 256 MiB follow-up.
A separate side-by-side run then put Spring Boot and Quarkus on the same 512 MB VM with the JDK 25 profile. Two Xmx80m JVMs left too little headroom. Read the Spring Boot vs Quarkus comparison.
Source
The method, demo, and measurements are in the public experiment repo. Star Pulse is included in the experiment tree. StatLite is the monitoring dashboard shown in the screenshots: a single Go binary using SQLite and Spring Boot Actuator.
Running Spring Boot on a small VPS? StatLite gives you monitoring without adding another heavyweight stack.