On a 512 MiB server, an 80 MiB heap still leaves a Spring Boot process well above 80 MiB. The number I am tracking is resident memory, RSS: the heap, plus metaspace, the code cache, thread stacks, and other native memory. I ran the same database-backed application three ways.
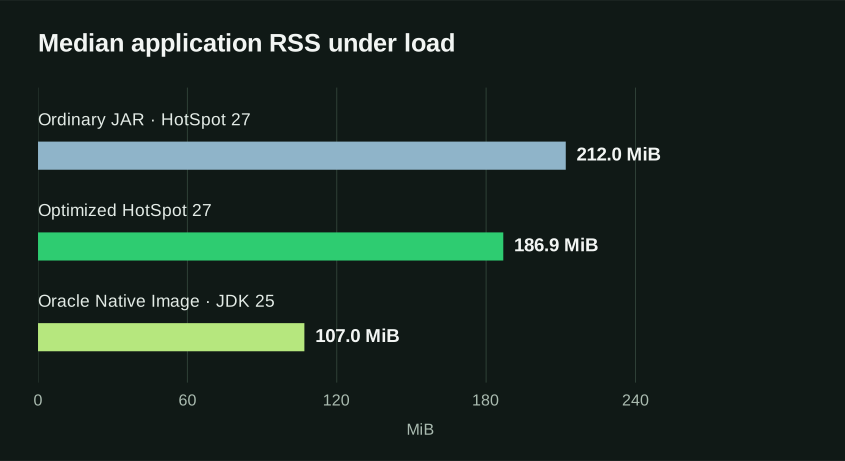
An ordinary executable JAR on JDK 27 used 212.0 MiB median RSS under load and took 11.91 seconds to become ready. Extracted layout, Spring AOT, and a trained JDK AOT cache brought that to 186.9 MiB and 3.79 seconds. Oracle Native Image on JDK 25 brought it to 107.0 MiB and 0.183 seconds. At five requests per second, latency stayed around 3.5 ms for all three.
The code and measurements are public.
The application and the budget
Market Replay polls a local quote feed once a minute, stores three quotes per batch, and serves latest-price and history endpoints plus a browser page. It uses Spring MVC, Tomcat, Jackson, Actuator, Spring JDBC, and HikariCP. There is no ORM in this application.
The guest was a local Ubuntu 24.04 VM with one vCPU, 512 MiB of RAM, and no swap. MariaDB and the Python quote fixture shared that budget. Linux reported about 456 MiB. Spring Boot was 4.1.1. The HotSpot runs used OpenJDK 27 with -Xmx80m and G1. Hikari kept one idle connection and at most four. MariaDB used a 64 MiB InnoDB buffer pool.
The native executable uses Oracle GraalVM 25.0.4, the current Native Image release, so that run is JDK 25 with the image's compiled Serial GC. It uses the same -Xmx80m heap cap.
This is another reason to prefer LTS releases over chasing the newest JDK. The latest JDK may be available before essential tools and ecosystem integrations support it; choosing a release means checking the whole toolchain, not just the JVM. Here, JDK 25 LTS provides the available native deployment path.
What changed on HotSpot
The ordinary deployment is the executable JAR, already on that heap cap and those database settings. The optimized deployment keeps the application, SQL, pool, and heap, and changes the launch:
- Spring Boot's extracted layout, so the application and its dependencies sit on disk as ordinary JARs.
- Spring AOT, which generates initialization code at build time.
- A JDK AOT cache trained for this application and reused on the next start.
The same workload
Each configuration started after its own reboot, with MariaDB restarted and an empty schema. I stopped the startup clock when health reported UP and the first three quotes were stored. Schema setup had already touched the disk, so these are fresh processes on a prepared filesystem.
After that: 60 seconds idle, 120 seconds of warm-up, five minutes of latest and history reads at five requests per second, and 60 seconds of recovery. At most four requests were in flight. The driver ran outside the guest. Quote ingestion kept its one-minute schedule.
| Measurement | Ordinary JAR, JDK 27 | Optimized HotSpot, JDK 27 | Native Image, JDK 25 |
|---|---|---|---|
| Readiness | 11.91 s | 3.79 s | 0.183 s |
| Median application RSS | 212.0 MiB | 186.9 MiB | 107.0 MiB |
| Lowest available memory | 25.6 MiB | 66.0 MiB | 204.9 MiB |
| HTTP p50 / p95 | 3.61 / 5.34 ms | 3.55 / 5.54 ms | 3.46 / 4.84 ms |
| Requests / errors | 1,500 / 0 | 1,500 / 0 | 1,500 / 0 |
Available memory is Linux MemAvailable for the whole guest, including MariaDB and the fixture. Application RSS is the Java process during the five-minute run.
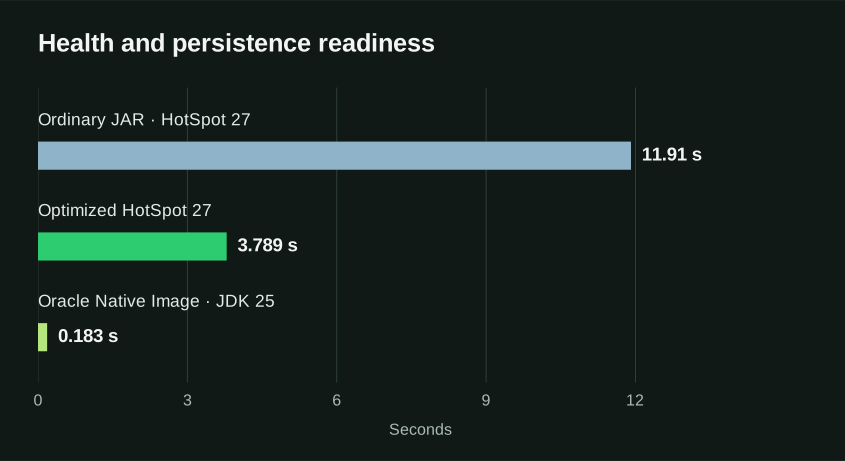
Native Image is 42.7% under the optimized HotSpot process. MariaDB stayed near 71 MiB in both of those runs, so that drop is in the application. Sampled application CPU over the five minutes was 6.28 seconds on optimized HotSpot and 1.67 seconds on the native executable.
p50 stayed between 3.46 and 3.61 ms. All three finished 1,500 requests with no errors, and none of them swapped.
Changing the stack
Replacing Spring JDBC with MyBatis Core, and owning sessions in the application, showed no useful saving. Against the same first minute of the optimized HotSpot run, median RSS was 186.0 MiB versus 187.2 MiB, and startup was 3.78 seconds versus 3.79. Datasource health and pool metrics went away with Spring JDBC, and separate repository calls no longer joined one Spring transaction. I kept Spring JDBC.
File-backed H2, on the same optimized HotSpot build, moved the database into the Java process. Application RSS rose to 202.9 MiB. With MariaDB stopped, the guest's lowest available memory rose from 66.0 MiB to 104.6 MiB. A smaller Java process and a smaller machine are different results. Request latency stayed in the same few milliseconds.
The cost of Native Image
The 107.0 MiB run is a default Oracle GraalVM build of this application. On a separate two-vCPU builder with 6 GiB of RAM, that Maven build took 11 minutes 48 seconds and peaked at about 5,070 MiB RSS. The executable file is 107 MiB.
The first Linux native binary compiled and started, but Jackson 2 could not deserialize the quote feed into QuoteBatch: native reflection metadata was missing. I added @RegisterReflectionForBinding(QuoteBatch.class) to QuoteClient and rebuilt. The generated metadata covered both QuoteBatch and its nested FixtureQuote type. Compilation and startup passed; exercising the quote feed exposed the failure.
Before measuring it, I ran the packaged binary through the behavior this service actually has: quote JSON, the API and the page, a restart with the rows still there, rollback of a failed insert, release of the connection, and recovery after the feed or MariaDB was down.
HotSpot was measured on October 23 and the native executable on October 28. Each figure above is one run of this application, on its own JDK and collector.
Monitoring the optimized application with StatLite
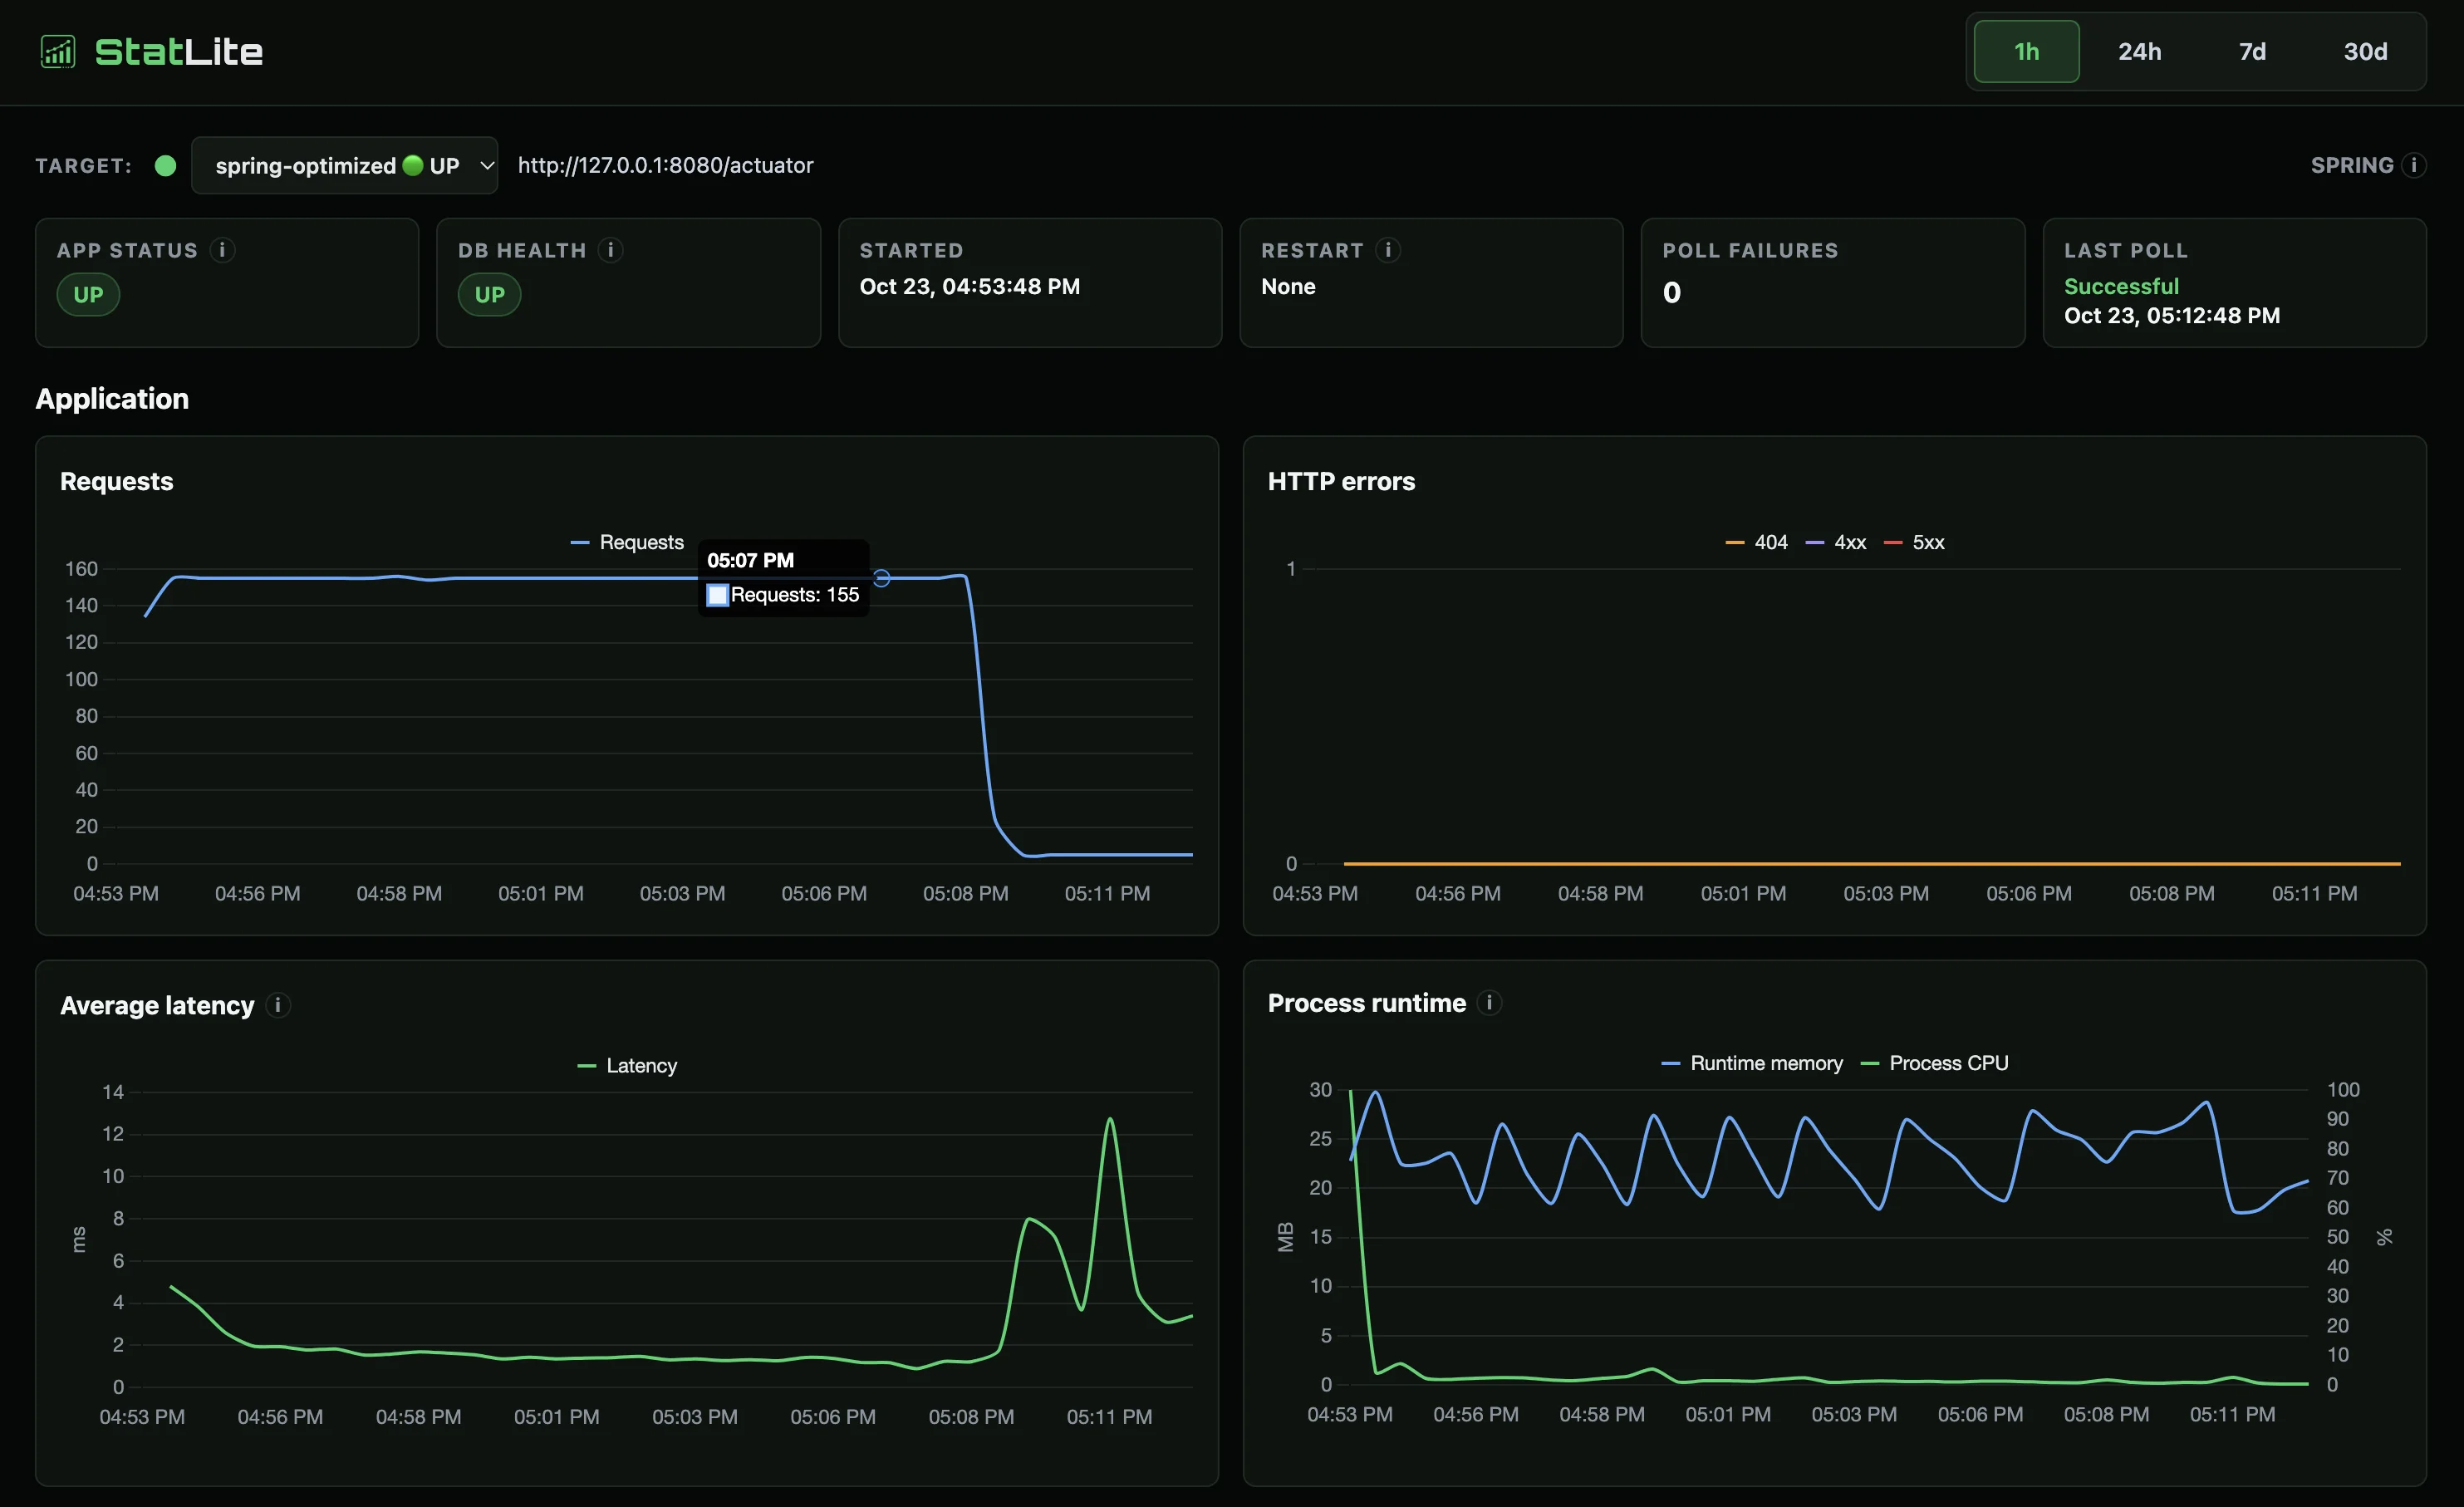
I also ran a separate 15-minute check of the optimized Spring Boot deployment using StatLite, a lightweight monitoring tool I develop and use in these experiments. StatLite collected application health and runtime metrics through Spring Boot Actuator while the application completed 4,500 requests without workload errors. StatLite itself used 11.9 MiB median RSS, with a sampled peak of 14.9 MiB, and the host retained at least 48.2 MiB MemAvailable. This was a separate observation with active health checks and a different warm-up schedule, not a controlled measurement of monitoring overhead.
What I would carry forward
On HotSpot I would ship the extracted layout, Spring AOT, and the trained cache, and I would keep Spring JDBC. Startup falls to a few seconds, the process gives back about 25 MiB, and the MyBatis replacement did not improve on that.
When the application and MariaDB have to share 512 MiB, I would use the native executable. Those runtime savings came with an almost 12-minute build, about 5 GiB of peak builder memory, and a Jackson reflection fix. The packaged binary also needed functional testing: compilation and startup alone missed a broken quote feed.
The experiment record has the method, the measurements, and the reproduction notes. The Native Image follow-up is recorded separately. See also the original article.
Experiment record HotSpot comparison Native Image record Reproduction guide