On a 512 MiB server, saving 25 MiB is useful. Saving it while keeping Spring's database integration, transactions and operational metrics is more useful still.
I ran the same database-backed Spring Boot application on JDK 27 in two deployment configurations: an ordinary executable JAR, and an extracted application using Spring AOT plus JDK 27's AOT cache (Leyden), trained for this application. The practical gain was host memory headroom: during measured load, the ordinary deployment had 148 of 298 samples below 32 MiB MemAvailable; the optimized deployment had none. Startup also fell from 11.91 to 3.79 seconds, and median application RSS was about 12% lower (212.0 → 186.9 MiB). These short runs do not establish long-term safety.
Then I tried two other changes: replacing Spring JDBC with manually integrated MyBatis Core, and replacing the local MariaDB service with file-backed H2. They answered different questions. The MyBatis integration showed no clear memory saving. H2 increased Java process memory but left more memory available on the host by removing the separate database process.
The public experiment record includes sample-level data, analysis scripts and limitations.
The application and the budget
The application polls a deterministic quote feed once a minute, persists three-row batches transactionally, and serves latest-price and history endpoints plus a browser UI. It uses Spring MVC, Tomcat, Jackson, Actuator, Spring JDBC and HikariCP. There is no ORM in this baseline.
The deployment budget was a local Ubuntu 24.04 x86_64 VM with one vCPU, 512 MiB RAM and no swap. Both the application and MariaDB ran inside that budget, along with the small Python feed fixture. This models a constrained single-server deployment; it is not a measurement from a commercial VPS provider.
Spring Boot was 4.1.1 and HotSpot was 27+35. The only JVM sizing flag was -Xmx80m; the JVM selected G1. Hikari's minimum/maximum pool size was 1/4. The small heap cap and connection pool keep the application's configured budgets conservative for a 512 MiB host shared with MariaDB; they are fixed inputs here, not the result of a tuning sweep. MariaDB used a 64 MiB InnoDB buffer pool, an 8 MiB MyISAM key cache and a 16 MiB Aria page cache, with durability defaults preserved. Those cache sizes are configuration budgets, not a limit on database RSS.
One compatibility qualification matters: Boot 4.1.1's tagged requirements list support through Java 26. These successful JDK 27 runs are empirical compatibility evidence, not a claim of official support.
Start with the deployment
The ordinary configuration used Spring Boot's standard executable JAR. The optimized configuration combined three changes: extracted layout, Spring AOT-generated initialization code, and a trained JDK AOT cache. Both still run on HotSpot. Neither uses native-image compilation. As the experiment repository explains, our focus is practical configurations that developers can readily adopt with familiar JVM tooling; GraalVM Native Image offers potential startup and memory benefits, but adds native compilation time and different compatibility and operational trade-offs.
Each configuration ran once, after its own VM reboot and database reset. Startup ended when HTTP health was UP and the first three quotes had been persisted. Then came 60 seconds idle, 120 seconds warm-up, five minutes of measured latest/history requests at 5 rps, and 60 seconds recovery.
| Measurement | Ordinary JAR | Extracted + Spring AOT + JDK cache |
|---|---|---|
| Startup to HTTP and persistence readiness | 11.91 s | 3.79 s |
| Median application RSS under load | 212.0 MiB | 186.9 MiB |
| Minimum host MemAvailable under load | 25.6 MiB | 66.0 MiB |
| Request latency, p50 / p95 | 3.61 / 5.34 ms | 3.55 / 5.54 ms |
| Successful measured requests | 1,500 / 1,500 | 1,500 / 1,500 |
Startup was about 68% shorter and median application RSS fell by 25.1 MiB. Latency was similar at this request rate. The test did not seek a throughput ceiling.
The host observation also matters. The ordinary deployment spent 148 of its 298 steady workload samples below 32 MiB MemAvailable. The optimized deployment had none. Both completed without OOM kills or swap, but the ordinary deployment left little room for additional activity. An earlier preparation attempt had been OOM-killed, so completing five minutes is not enough to call this budget comfortable.
The 40.4 MiB improvement in minimum host MemAvailable cannot all be credited to the 25.1 MiB app RSS saving. Database and fixture residency also varied. RSS describes resident process pages; Linux MemAvailable estimates host memory available for additional work. They answer related but different questions.
This comparison also cannot tell us how much each optimization contributed. I previously examined extracted layout on its own. Here the question was what the combined deployment buys for this application.
The earlier Spring Boot low-memory investigation on JDK 25 provides small-server context. Its application and memory/swap configurations differ, so its measurements are not directly comparable to this JDK 27 deployment.
The optimized build has a maintenance cost
Builds and startup-only cache training ran on a separate Linux builder. Trying to train inside the 512 MiB deployment VM was OOM-killed during preparation.
The trained cache needs compatible application inputs, JDK and platform. Bean-affecting build and runtime settings also need to agree. I transferred the trained application as a timestamp-preserving archive and checked JVM logs to confirm actual cache use.
That last check caught a real preparation problem: transferring loose JARs changed timestamps, so the JVM rejected the caches even though the applications passed their functional checks. Preserving timestamps fixed the transfer. Application health alone would have missed the fallback.
These are manageable deployment steps, but they belong in the build pipeline. The published method records the preparation and validation; the data guide explains how to reanalyze the released measurements. The curated release does not include the complete application and build source needed to rerun the deployment.
Removing Spring JDBC did not provide a clear return
For a bounded follow-up, I replaced Spring JDBC with MyBatis Core and application-managed sessions and transactions. Six Spring JDBC/transaction-related JARs disappeared; one MyBatis JAR was added. Total runtime JAR bytes actually increased by about 0.77 MB. Dependency count alone says little about memory use.
In the matched first minute of recorded load, median app RSS was 187.2 MiB for JDBC and 186.0 MiB for MyBatis. Idle RSS moved in the other direction, from 178.7 to 181.7 MiB. Startup was essentially unchanged, and both served 300/300 matched requests without errors. This single short capture showed no clear memory saving worth pursuing.
The integration costs were concrete. Automatic datasource health and JDBC/Hikari metrics were absent. The application owned session creation, commit, rollback and cleanup, and separate repository calls no longer automatically joined Spring declarative transactions. A tested late-insert failure rolled back the local batch, but transaction composition still needed application design.
That finding applies to this manual MyBatis Core integration inside Spring Boot. MyBatis with framework transaction integration was not tested. I would keep Spring JDBC for this application rather than maintain the replacement for an unproven memory benefit. The MyBatis results retain the dependency inventory and matched measurements.
Embedded H2 changes the deployment shape
The next follow-up kept the optimized JDBC deployment and replaced MariaDB with durable, file-backed H2. It used its own trained cache and the original five-minute measured workload. MariaDB was stopped, and monitoring remained off.
Both optimized MariaDB and H2 deployments completed 1,500/1,500 requests without errors. Median app RSS increased from 186.9 to 202.9 MiB with H2, while minimum host MemAvailable increased from 66.0 to 104.6 MiB. MariaDB's separate process had used about 70.6 MiB median RSS; H2's database memory lived inside the Java process.
Median app RSS (MiB)
Minimum host MemAvailable (MiB)
| Request latency | Optimized MariaDB | Optimized H2 |
|---|---|---|
| p50 | 3.55 ms | 3.35 ms |
| p95 | 5.54 ms | 5.67 ms |
These short runs showed no clear response-time advantage. H2's observed benefit was additional host memory headroom.
The existing JVM gauges showed only small changes: H2's median heap use was about 1.6 MiB higher and non-heap use about 1.7 MiB lower. Those gauges do not explain the full RSS difference, and no complete native-allocation measurement was taken. An 80 MiB maximum heap is not an 80 MiB process budget.
File-backed H2 is a deployment choice for an application whose single-instance architecture fits it. The database shares the application's process and lifecycle, and backup and upgrade procedures need to account for the open database. A separate database service provides an independent operational boundary and a shared persistence endpoint if the application later gains multiple instances. It can initially live on the same server, while still consuming part of that server's budget.
This run did not test backup recovery, multi-instance behavior or equivalent database guarantees. Its similar request latency is not a database-performance result. The useful observation is narrower: removing the separate database service left more host headroom, despite increasing application RSS.
Watching the optimized app with StatLite
I also develop StatLite, a lightweight monitoring tool, so I used it for a separate 15-minute check of the optimized Spring Boot/MariaDB deployment. Its native Spring Boot Actuator integration brings health and runtime metrics into a dashboard with history, making it useful for inspecting the application after a deployment change.
The app completed 4,500/4,500 requests at 5 rps without workload errors. StatLite's own RSS was 11.9 MiB median and 14.9 MiB sampled peak on the same VM; minimum host MemAvailable was 48.2 MiB. This run used a development build and included active health checks. It was a separate observation with a different warm-up schedule, so it does not isolate monitoring overhead or extend the main comparison into a long-term stability claim.
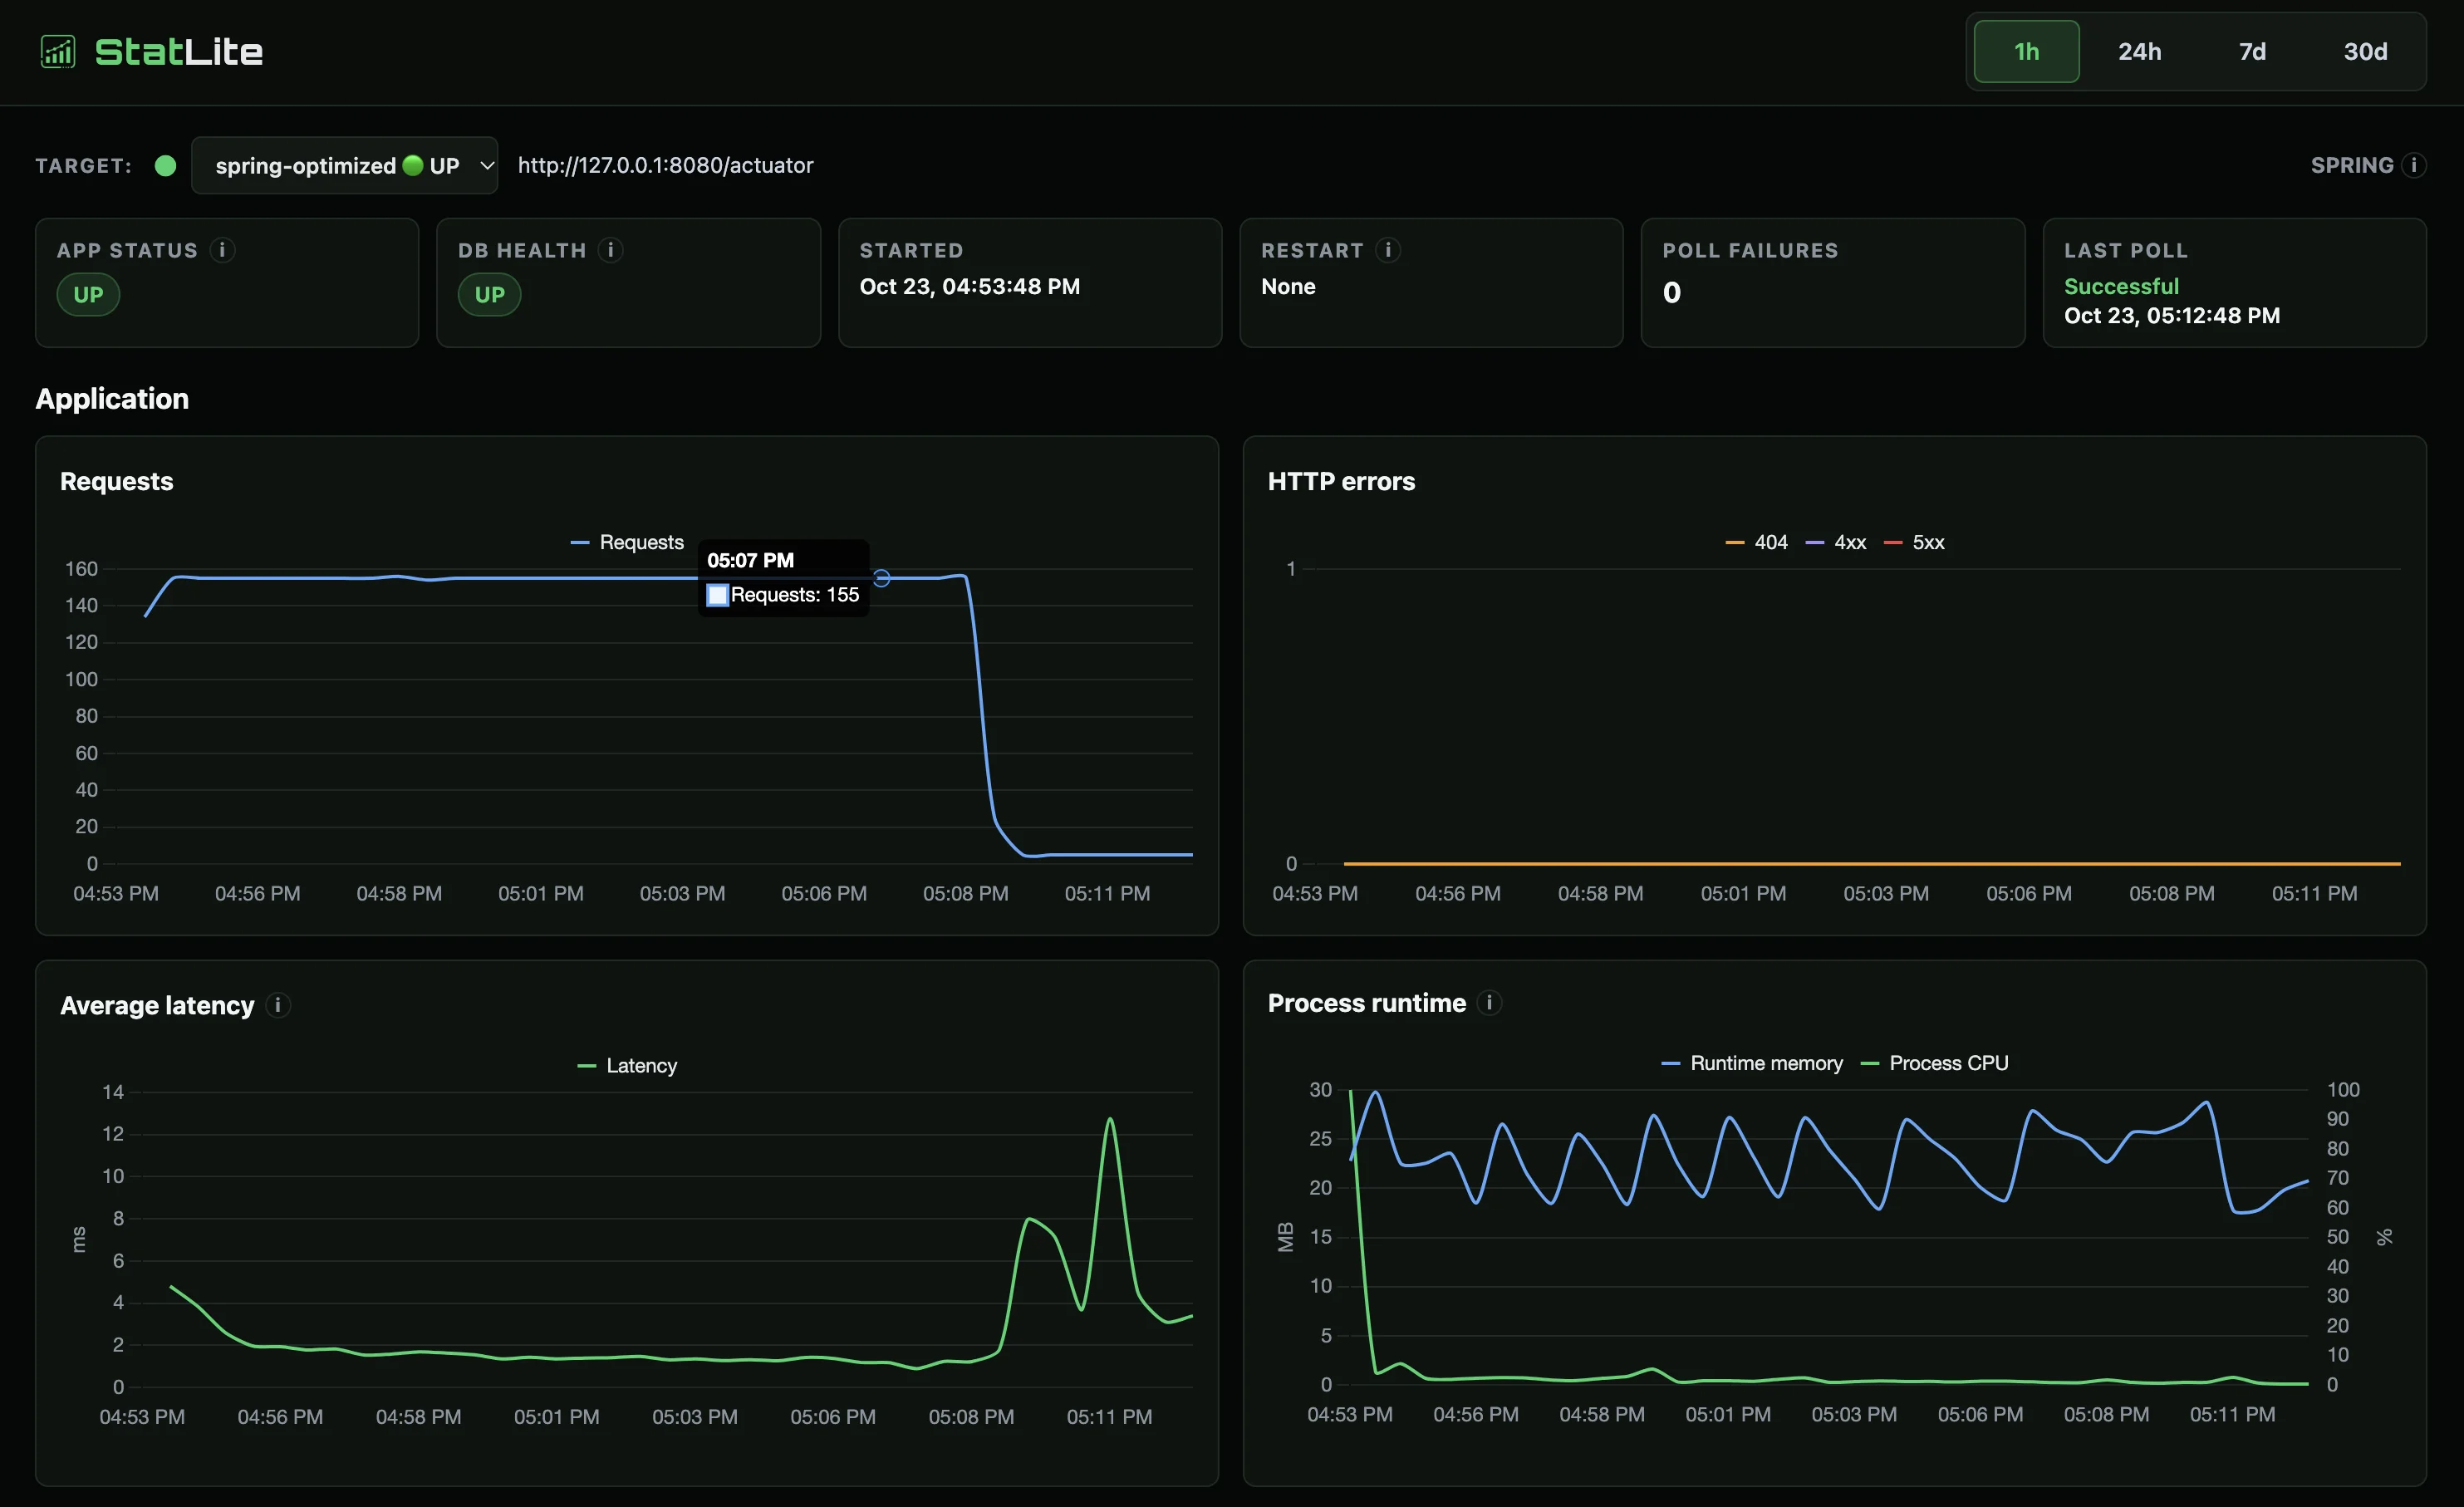
If you already expose Actuator and want a small monitoring dashboard for a deployment like this, the StatLite Spring Boot guide shows how to connect it.
What I would carry forward
For this application, I would keep Spring JDBC and use the optimized deployment when the build pipeline can own cache training and validation. The observed startup and RSS savings justify that preparation work more clearly than the manual persistence replacement did.
I would choose embedded H2 only when the application's lifecycle and single-instance requirements fit an embedded database. If the service needs independent database operations or a shared database for several app instances, I would budget for a separate service instead.
These are short, sequential observations: one run per main configuration, a fixed ordinary-then-optimized order, and a five-minute measured workload at 5 rps. They do not quantify run-to-run variability, establish capacity or prove long-term safety. They do provide a practical reason to optimize the deployment before removing useful Spring infrastructure.