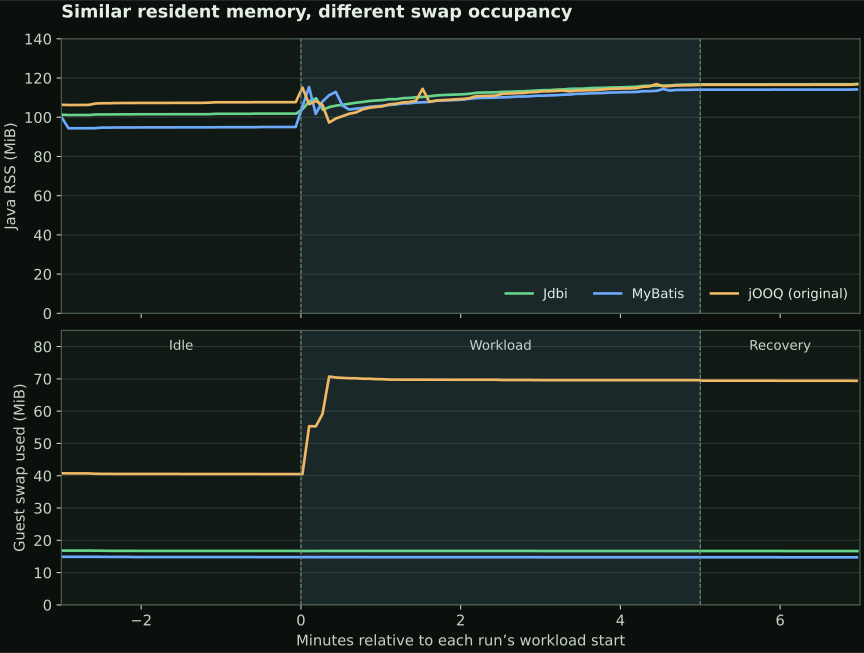
All three applications completed the workload, with median Java RSS around 111–113 MiB. Their paging, package sizes, and application responsibilities differed.
Why compare SQL-first persistence libraries?
The earlier Javalin and Spring Boot experiment used raw JDBC to keep database work explicit. For an application I would maintain, I also wanted to compare libraries that take over some of that work.
This experiment records runtime, package, and application-code measurements for Jdbi Core, MyBatis Core, and jOOQ Open Source Edition in the same Javalin application on a 256 MiB server. It describes the implementation responsibilities and observed resource use of explicit SQL APIs and a type-safe SQL DSL, using conventional HotSpot and minimal infrastructure.
Shared application and setup
All three variants use the same plain Java repository contract and domain records, constructor-injected controller, explicit application wiring, H2 file database, HikariCP pool, StatLite monitoring, JVM flags, routes, fixture, SQL semantics, and workload. The controller remains independent of each persistence library. Each implementation uses explicit repository construction and keeps framework-specific failures inside its persistence layer, while using idiomatic internals for its library.
The common 256 MiB experiment configuration used an Alpine Linux 3.24.2 VM with one vCPU, 256 MiB nominal memory (about 214.9 MiB guest MemTotal), 512 MiB swap, and swappiness 60. The runtime was OpenJDK 25.0.4 with -Xms16m -Xmx80m -XX:+UseSerialGC -Xss512k. StatLite 0.6.0, the monitor I develop at PVR Labs, polled at 30-second intervals. The workload lasted five minutes and scheduled 1,500 requests at five per second, with an 80/20 read/write mix and at most four outstanding requests. The MyBatis implementation and measurement record documents checks, inputs, and deviations.
There is one completed run per library. The measurements describe these applications and do not establish a statistically reliable ranking.
Jdbi Core implementation
The Jdbi variant uses Jdbi Core 3.55.0 with explicit Hikari, Jdbi, repository, and controller wiring. A plain QuoteRepository interface separates the controller from JdbiQuoteRepository. SQL and database-error translation stay in the persistence layer, with no DI container or extra service layer. Latest quotes use three queries on one handle; Jdbi constructs a query for each symbol where the raw JDBC baseline reused one prepared statement.
The full Jdbi results include acceptance checks, dependency measurements, and a comparison with the original JDBC application. In that comparison, Jdbi reached readiness 1.67 seconds later and used 6.41 MiB more workload RSS. Application restructuring also contributed to those differences, so they do not isolate Jdbi’s intrinsic overhead.
MyBatis Core implementation
The MyBatis variant uses MyBatis Core 3.5.19, an annotated mapper interface with visible SQL text blocks, an explicitly built SqlSessionFactory, and repository-owned session lifecycles. Its controller, repository interface, records, routes, H2/Hikari configuration, and portable error responses match the Jdbi application. Its first-level local cache is scoped to statements. Three-row writes use ExecutorType.BATCH, followed by an explicit flush and commit; preparation checks verified rollback when a later row conflicts.
jOOQ Open Source Edition implementation
The jOOQ Open Source Edition 3.21.9 application uses QuoteController → QuoteRepository → JooqQuoteRepository, a Hikari datasource, an H2 DSLContext, and generated quotes table and field types. The repository builds its lookups and inserts with jOOQ DSL expressions and maps results to the unchanged plain Java records. Request batches use a transaction-scoped DSL context and Batch.execute(); preparation confirmed rollback when a later row conflicts. A later correction also made fixture loading transactional and passed a separate host-side rollback/recovery check. That correction was not in the original VM run. Schema generation runs on the host from the same DDL resource used at startup, with generated classes separate from handwritten source.
Runtime comparison
Each measured artifact completed one five-minute workload with 1,500 successful requests and the same final database state. These are three individual runs and do not establish a stable library ranking.
| Measurement | Jdbi Core 3.55.0 | MyBatis Core 3.5.19 | jOOQ OSE 3.21.9, original artifact |
|---|---|---|---|
| Readiness, including schema and fixture setup | 4.13 s | 3.59 s | 4.44 s |
| Idle median Java RSS | 101.55 MiB | 94.85 MiB | 107.32 MiB |
| Workload median Java RSS | 112.83 MiB | 110.55 MiB | 112.19 MiB |
| Workload peak Java RSS | 116.78 MiB | 115.39 MiB | 116.93 MiB |
| Recovery median Java RSS | 116.80 MiB | 114.09 MiB | 116.55 MiB |
Minimum workload MemAvailable |
55.04 MiB | 59.52 MiB | 57.29 MiB |
| Maximum swap used during application phases | 17.20 MiB | 15.61 MiB | 70.71 MiB |
| Workload swap-in / swap-out | 0.20 / 0.05 MiB | 0.12 / 0.00 MiB | 19.11 / 31.19 MiB |
| Workload guest busy CPU / Java CPU | 3.42% / 2.67% | 3.81% / 3.05% | 3.87% / 3.12% |
| Aggregate HTTP p95 | 7.39 ms | 8.23 ms | 9.34 ms |
| Successful workload requests | 1,500 / 1,500 | 1,500 / 1,500 | 1,500 / 1,500 |
| Final database state | 2,070 rows; sequence 689; sum 630374.22 | 2,070 rows; sequence 689; sum 630374.22 | 2,070 rows; sequence 689; sum 630374.22 |
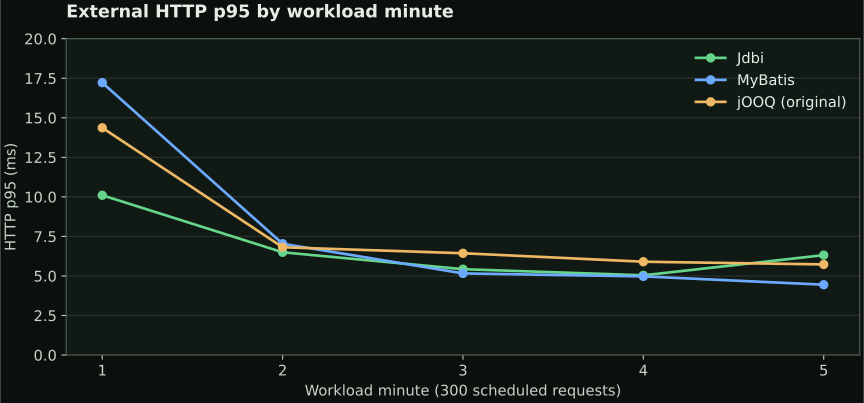
MyBatis' first workload minute had a 17.22 ms p95; its next four minute p95 values ranged from 4.44 to 7.04 ms. This is one five-minute run and should not be read as a stable latency distribution. The detailed MyBatis analysis contains phase samples and route-level values; the Jdbi analysis remains unchanged.
Despite similar resident memory, the original jOOQ run had substantially more workload paging: 19.11 MiB swapped in and 31.19 MiB swapped out, compared with 0.20 / 0.05 MiB for Jdbi and 0.12 / 0.00 MiB for MyBatis. Guest-wide swap occupancy peaked at 70.71 MiB in the jOOQ run, with most workload swap-out activity in the first 25 seconds.
jOOQ’s first-minute HTTP p95 was also higher than in later minutes: 14.37 ms versus 5.73–6.81 ms. Paging and higher latency overlapped, but this single run does not establish causation. All three runs retained at least 55 MiB of available memory during the workload.
The jOOQ analysis includes phase samples, minute-level latency and RSS, and CPU details. The MyBatis analysis and Jdbi analysis remain individually preserved. No runs were averaged.
Measurement provenance note: The jOOQ runtime measurements and 19,188,345-byte JAR describe the original implementation used in the archived run. A subsequent correction made fixture initialization transactional and passed a separate host-side rollback and recovery check. The corrected implementation has not been VM-measured; the recorded readiness and resource figures belong to the original build. See the correction record.
Dependency and application footprint
The jOOQ shaded application JAR is about 18.3 MiB. Its additional runtime dependency set is jOOQ 3.21.9, r2dbc-spi 1.0.0.RELEASE, and reactive-streams 1.0.3. The latter two arrive transitively; the application uses JDBC. Code generation uses jooq-codegen-maven 3.21.9, its jooq-codegen and jooq-meta modules, and H2 2.4.240 in the Maven plugin realm, outside the measured application classpath. See the resolved runtime dependency tree, build-only artifact record, dependency verification, and code-cost record for artifact details.
How much application code does each approach require?
Code size is a first-class measurement alongside RSS and startup. The existing handwritten Java counts use the same method: count nonblank, noncomment physical Java lines across application startup, repository, mapper, domain records, controller, error handling, and wiring. The identical 83-line StatLite adapter is excluded from the primary comparison and recorded separately. These are counts, not maintainability scores.
| Application code and measured package size | Jdbi | MyBatis | jOOQ |
|---|---|---|---|
| Handwritten Java lines, excluding shared StatLite adapter | 207 | 358 | 293* |
| Unchanged StatLite adapter Java lines, reported separately | 83 | 83 | 83 |
| Generated Java files / generated Java lines | 0 / 0 | 0 / 0 | 6 / 224 |
| Compiled generated-class footprint | 0 bytes | 0 bytes | 14,695 bytes |
| Shaded JAR size (bytes) | 14,818,339 | 15,479,070 | 19,188,345 |
* The jOOQ count includes the fixture-loading correction: 293 lines. The original measured version had 280 lines and required that correction. JAR sizes describe the measured builds.
The identical contract, controller, validation, record types, and portable error class account for 72 handwritten Java lines in each variant. Jdbi then has a 30-line application entry point and a 105-line repository. MyBatis has a 52-line entry point, 151-line repository, and 83-line annotated mapper. The corrected jOOQ implementation has a 45-line entry point and a 176-line DSL repository. The jOOQ generator emitted six Java files and 224 nonblank, noncomment lines; the compiled generated classes total 14,695 bytes. Generated code is shown separately and is not added to handwritten LOC.
Where the application code lives
The comparison below uses the Jdbi repository, MyBatis repository and mapper, and original measured jOOQ repository. The corrected jOOQ repository adds atomic fixture initialization and was tested separately.
SQL organization
| Jdbi Core | MyBatis Core | jOOQ Open Source Edition |
|---|---|---|
| SQL text blocks live beside query execution in the repository. | SQL lives in annotated mapper methods, called by the repository. | Queries use Java DSL expressions in the repository. |
Parameter binding and type checks
| Jdbi Core | MyBatis Core | jOOQ Open Source Edition |
|---|---|---|
Named parameters such as :symbol; a registered mapper constructs Quote records. SQL columns are checked at runtime. | @Param names bind to #{...} placeholders; annotations describe record mapping. SQL columns are checked at runtime. | Generated fields provide compiler-checked column names and Java types. Fetched records are mapped to Quote records. |
Transactions and resources
| Jdbi Core | MyBatis Core | jOOQ Open Source Edition |
|---|---|---|
withHandle scopes connection use; useTransaction wraps fixture and request batches. | The repository opens and closes SqlSession, flushes batches, and explicitly commits or rolls back. | DSLContext.transaction wraps request batches. Fixture loading uses it only in the corrected, unmeasured build. |
Code generation and build complexity
The Maven generate-sources phase runs org.jooq:jooq-codegen-maven:3.21.9 against an in-memory H2 2.4.240 database initialized from src/main/resources/schema.sql. It generates only the QUOTES schema model under target/generated-sources/jooq. mvn -f javalin/sql-persistence-256mb/javalin-jooq/pom.xml clean package regenerates the model before compiling and shading the application. After a schema change, update the DDL resource, regenerate, inspect generated types, and rerun functional preparation. The generator runs on the host and its plugin dependencies do not enter the shaded runtime JAR.
Check jOOQ’s database support
Before choosing jOOQ, check whether its Open Source Edition supports your database and version. It supports databases such as H2, PostgreSQL, MySQL, MariaDB, and SQLite, but Oracle and SQL Server require a commercial edition. Older database versions may also require a commercial edition. See the edition list and version support matrix for your target database.
Limitations and conclusion
All three implementations completed the same workload with similar resident memory. The clearest differences were in paging, package size, and application code. Jdbi required the fewest handwritten Java lines here; MyBatis kept SQL in annotated mappers; jOOQ provided generated, typed schema references with an additional build step.
These are observations from one small, deterministic workload on a local VM, with one run per implementation. They do not isolate intrinsic library overhead or establish a performance ranking. The jOOQ figures describe the original measured build; the fixture-initialization correction was tested separately and remains unmeasured in the VM.
See the original Javalin vs. Spring Boot experiment.
Sources and reproduction
The public package includes the application sources, original OS and HTTP samples, measured-source provenance, dependency and code inventories, and the separate jOOQ fixture correction.