Three SQL persistence approaches can all run this small Javalin application comfortably on a VM with 512 MiB RAM. Their resource use still differs. In two runs per implementation, MyBatis Core had the lowest median workload RSS, Jdbi Core remained competitive on HTTP latency, and jOOQ Open Source Edition had a substantially larger resident footprint. All six runs completed correctly, without workload errors, OOM events or swapping.
This is a comparison of three implementations of the same application, using Jdbi Core 3.55.0, MyBatis Core 3.5.19 and jOOQ OSE 3.21.9. It is a repeated case study of SQL persistence in Javalin, with a separate monitored MyBatis follow-up. Two runs per library provide a consistency check; they do not establish a universal performance ranking.
The application and workload
The application is a small market-quote API for three stock symbols. It serves the latest quote for each symbol, returns bounded quote history, and accepts transactional batches containing one new quote for each of the three symbols. Controllers, validation, domain records and the repository contract are shared in shape; persistence code uses each library's own APIs.
The initial dataset contains 1,170 rows: 390 quote batches across three symbols. The quotes table has an identity primary key, a unique constraint on (batch_seq, symbol) and an index on (symbol, id DESC). Latest and history reads use a symbol predicate, descending ID order and a limit:
SELECT batch_seq, cycle, sample_index, market_time, symbol, price
FROM quotes
WHERE symbol = ?
ORDER BY id DESC
LIMIT ?
A latest-quotes request performs three indexed reads with limit 1. A history request reads 60 rows for one symbol and reverses them into ascending history order for the response. Writes batch this statement three times within one transaction:
INSERT INTO quotes(batch_seq, cycle, sample_index, market_time, symbol, price)
VALUES (?, ?, ?, ?, ?, ?)
Each five-minute workload schedules 1,500 HTTP requests at five per second: 300 latest-quotes reads, 900 history reads and 300 writes. That is an 80/20 read/write mix, with at most four requests outstanding and no retries. The load generator runs outside the guest and checks response status and contents. A successful run ends with 2,070 rows, maximum batch sequence 689 and a price sum of 630374.22, calculated as SUM(price) across all persisted quote rows. This deterministic total is a final-state correctness check.
H2 is a deliberate self-contained database choice: there is no separate database server to fit into the guest budget. Its runtime and cache contribute to the application's RSS. Each application uses file-backed H2 2.4.240 with CACHE_SIZE=4096, a 4 MiB cache limit (H2 defines the setting in units of 1,024 bytes), through HikariCP 7.0.2 with minimum idle 1 and maximum pool size 2. This keeps deployment small; it does not remove database variance or establish how these implementations would behave with PostgreSQL.
The workload exercises common reads and transactional inserts with deterministic data. It is neither representative production traffic nor a capacity test.
Why repeat the 256 MiB experiment?
The original experiment used a 256 MiB VM, swap enabled, StatLite monitoring and one run per library. Jdbi's HTTP p95 was 7.39 ms versus MyBatis's 8.23 ms, while MyBatis used slightly less median workload RSS: 110.55 versus 112.83 MiB. Swapping complicated the earlier RSS comparison, particularly for jOOQ: RSS counts resident pages, and swap-out activity does not tell us how much memory was swapped at a particular instant. The new experiment disables swap to remove that confound.
Those remain valid observations under their recorded conditions. They were insufficient for a confident comparison, motivating a repeat with more memory, no swap, no external monitoring during the main runs, and two runs per library. The old and new results are separate configurations. RAM, swap policy, monitoring, phase timing and reviewed application code changed, including jOOQ's corrected transactional fixture initialization. Their measurements are not combined, and differences cannot be attributed to RAM alone.
The 512 MiB method
The guest is an Alpine Linux 3.24.2 VM on an Intel Mac using Lima VZ, with one vCPU and 512 MiB configured RAM. Linux reported about 466.5 MiB usable MemTotal. Swap was disabled. Every variant used OpenJDK 25.0.4 and the same explicit JVM policy:
-Xms16m -Xmx80m -XX:+UseSerialGC -Xss512kThe common web stack includes Javalin 7.2.3 and Jetty 12.1.12. All applications retain the same Micrometer instrumentation and metrics adapter, but no StatLite process or metrics polling ran during the six main measurements. Thus "unmonitored" here means without the external StatLite collector, rather than without application instrumentation or independent OS sampling.
Application builds were reviewed, checked and frozen before measurement. Repository checks exercised commit, rollback and fixture recovery; preparation smokes covered launch, HTTP behavior, sampling, collection and shutdown. Before each measured run, the guest was rebooted and the application used a fresh database. A guest reboot does not imply cold physical-host caches.
Each run recorded 30 seconds without Java, startup to readiness, 30 seconds idle, the five-minute workload and recovery, a 30-second post-workload observation period. Independent OS samples used one-second startup and five-second steady cadence. RSS is process resident memory under this JVM policy, including embedded H2; it is not a library's minimum required memory. HTTP percentiles are external client measurements, including the local forwarding path, rather than server-handler timings.
The first round ran Jdbi, MyBatis, jOOQ; the second reversed that order. This reduces one simple order bias but does not fully balance order effects. Each run had a distinct guest boot, and acceptance required complete request logs, zero workload errors, exact final database state and valid sampling coverage.
Latency, memory and repeatability
Each row below is a separate run. Requests are not pooled across repetitions. RSS values summarize the workload phase; CPU is guest-wide busy time over that phase, expressed as a percentage of the single vCPU.
| Implementation | Round | HTTP p50, ms | HTTP p95, ms | Median RSS, MiB | Peak RSS, MiB | Ready, s | Guest CPU, % |
|---|---|---|---|---|---|---|---|
| Jdbi Core | 1 | 4.10 | 8.48 | 122.4 | 128.2 | 3.45 | 3.84 |
| Jdbi Core | 2 | 3.73 | 7.38 | 120.0 | 123.6 | 3.11 | 3.49 |
| MyBatis Core | 1 | 3.24 | 7.52 | 116.6 | 123.3 | 2.77 | 3.55 |
| MyBatis Core | 2 | 3.60 | 7.47 | 118.0 | 123.4 | 2.68 | 3.76 |
| jOOQ OSE | 1 | 3.62 | 9.35 | 152.1 | 156.4 | 4.10 | 3.80 |
| jOOQ OSE | 2 | 4.01 | 9.19 | 154.3 | 158.4 | 4.37 | 3.74 |
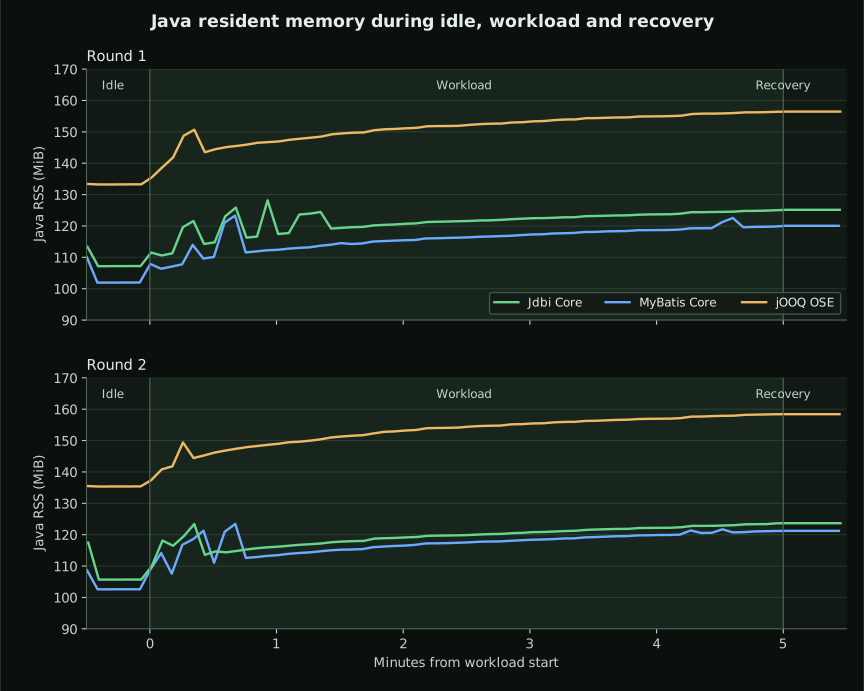
MyBatis had the lowest median workload RSS in both rounds. Jdbi was close, while jOOQ's medians were about 34–38 MiB higher than MyBatis's. That larger resident footprint repeated without swapping; its cause was not isolated. These are whole-application observations, not estimates of intrinsic library overhead.
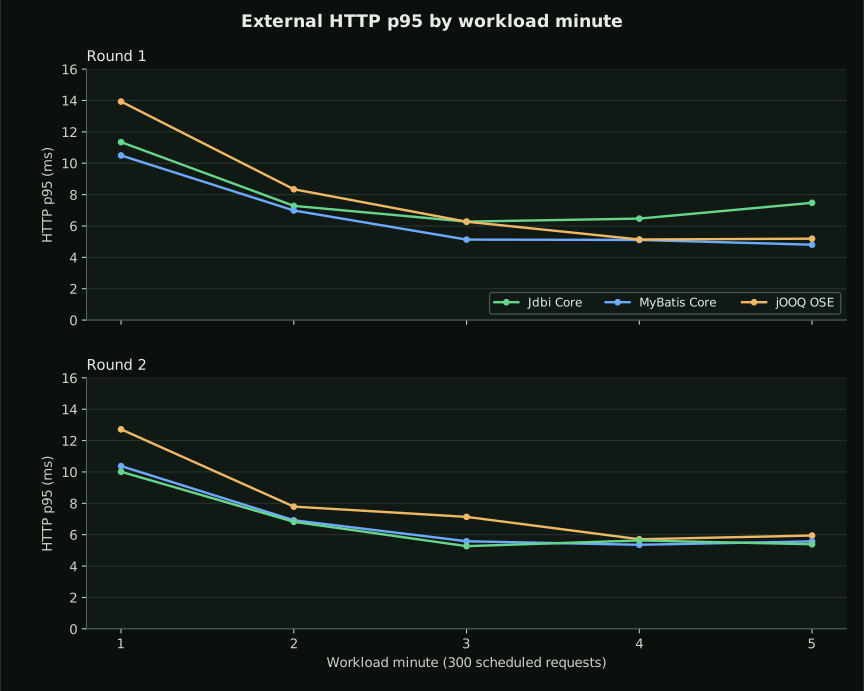
Jdbi and MyBatis had overlapping p95 ranges: 7.38–8.48 ms and 7.47–7.52 ms. Jdbi's second p95 was slightly lower than either MyBatis result, while MyBatis was lower in the first round. There is no demonstrated significant latency advantage for either. jOOQ's p95 was 9.19–9.35 ms in these runs. With only two repetitions, these differences should not become broad statistical claims.
MyBatis also reached readiness sooner in both rounds, followed by Jdbi and jOOQ. Startup includes schema creation and loading the fresh fixture, so these times do not isolate framework or library initialization. CPU remained low at this offered load, with guest busy time between 3.49% and 3.84% across all six runs. This says little about behavior near saturation.
All six runs completed 1,500 requests without errors and reached the expected database state. No OOM events or workload major page faults were recorded, and available memory during workload never fell below 272.6 MiB. The short recovery phase is not a memory-leak or long-term stability test.
What the repository code looks like
All three implementations keep an ordinary repository interface and domain records. The following excerpts show the same latest-quotes operation from the measured source. SQL constants, mapping setup and error translation are explained alongside the excerpts; complete source is linked for each implementation.
Jdbi: SQL and binding in the repository
return operation(() -> jdbi.withHandle(handle -> {
    var rows = new ArrayList<Quote>(QuoteBatch.SYMBOLS.size());
    for (var symbol : QuoteBatch.SYMBOLS) {
        handle.createQuery(SELECT).bind("symbol", symbol).bind("limit", 1)
            .mapTo(Quote.class).findOne().ifPresent(rows::add);
    }
    return rows;
}));
SELECT is the explicit SQL above, using :symbol and :limit parameters. The constructor registers a row mapper reading named columns into a Quote. withHandle scopes the handle and pooled connection across all three queries. Writes use useTransaction and a closed PreparedBatch; transaction ownership is visible in repository code. See the Jdbi repository.
MyBatis: annotated SQL behind mapper methods
return operation(() -> withMapper(mapper -> {
    var rows = new ArrayList<Quote>(QuoteBatch.SYMBOLS.size());
    for (var symbol : QuoteBatch.SYMBOLS) {
        var quote = mapper.selectQuotes(symbol, 1);
        if (quote != null) rows.add(quote);
    }
    return rows;
}));
withMapper opens a SIMPLE, auto-commit SqlSession in try-with-resources, holding one pooled connection across the three reads. The corresponding declarations in QuoteMapper make the SQL, binding and mapping explicit:
String LATEST_OR_HISTORY = """
    SELECT batch_seq,cycle,sample_index,market_time,symbol,price
    FROM quotes
    WHERE symbol=#{symbol}
    ORDER BY id DESC
    LIMIT #{limit}
    """;

@Select(LATEST_OR_HISTORY)
@ConstructorArgs({
    @Arg(column="batch_seq", javaType=int.class),
    @Arg(column="cycle", javaType=int.class),
    @Arg(column="sample_index", javaType=int.class),
    @Arg(column="market_time", javaType=String.class),
    @Arg(column="symbol", javaType=String.class),
    @Arg(column="price", javaType=BigDecimal.class)
})
Quote selectQuotes(@Param("symbol") String symbol, @Param("limit") int limit);
These two excerpts come from the repository and mapper interface respectively; the mapper excerpt omits intervening declarations. @Select references the SQL constant, @Param names the bound parameters, and @ConstructorArgs maps the six selected columns into the record. The short repository call depends on these separate declarations rather than eliminating SQL and mapping code.
The application explicitly builds an environment and session factory and sets localCacheScope=STATEMENT. This overrides the SESSION default, preventing local-cache results from being shared across separate statements; it is not a general freshness guarantee across transactions. See the MyBatis configuration documentation. Writes use a BATCH session with explicit flush, commit and rollback on failure. See the repository, mapper and application setup.
jOOQ: queries expressed through schema types
return operation(() -> {
    var rows = new ArrayList<Quote>(QuoteBatch.SYMBOLS.size());
    for (String symbol : QuoteBatch.SYMBOLS) {
        var row = dsl.select(QUOTES.BATCH_SEQ, QUOTES.CYCLE, QUOTES.SAMPLE_INDEX,
                QUOTES.MARKET_TIME, QUOTES.SYMBOL, QUOTES.PRICE)
            .from(QUOTES).where(QUOTES.SYMBOL.eq(symbol))
            .orderBy(QUOTES.ID.desc()).limit(1).fetchOne();
        if (row != null) rows.add(map(row));
    }
    return rows;
});
QUOTES contains generated table and field types; the handwritten map method constructs the ordinary domain record. Setup creates a datasource-backed DSLContext with the H2 dialect. Writes use a transaction-scoped context and a bound batch. Schema generation is a Maven build step, outside measured startup. See the jOOQ repository and build configuration.
There is a retained connection-lifecycle difference: the datasource-backed jOOQ context checks out and returns a pooled connection for each of the three reads. Jdbi and MyBatis hold one across them. Three logical pool cycles do not imply three new physical connections. The effect is unmeasured, so equivalent SQL does not justify attributing latency or CPU differences to intrinsic library cost. None of these three-read operations promises an atomic snapshot across symbols under concurrent writes.
Packaging and developer experience
| Measured build | Jdbi Core | MyBatis Core | jOOQ OSE |
|---|---|---|---|
| Runnable JAR, MiB | 14.13 | 14.76 | 18.30 |
| Handwritten Java lines, excluding metrics adapter | 320 | 413 | 339 |
| Generated Java files / lines | 0 / 0 | 0 / 0 | 6 / 224 |
The packages include the common web, H2, pooling and instrumentation stack. Library-specific runtime dependencies are Jdbi Core plus GeAnTyRef 2.0.1; MyBatis Core alone; and jOOQ plus R2DBC SPI 1.0.0.RELEASE and Reactive Streams 1.0.3. The jOOQ application uses JDBC; the latter two are transitive runtime dependencies. Its code-generation plugin and supporting generation dependencies belong to the build, not application startup.
Line counts use nonblank physical Java lines, excluding full-line comments, and include application wiring, initialization, repository, mapping, controller and domain/error code. The identical 83-line metrics adapter is reported separately. Physical line counts depend on formatting and are not a complexity or maintainability score. The build inventory contains exact package sizes and resolved dependencies.
The counting scope is unchanged from the 256 MiB experiment, but these are revised implementations. Readability formatting, mapping, fixture handling and startup/shutdown cleanup changes raised handwritten counts from 207 to 320 for Jdbi and 358 to 413 for MyBatis. jOOQ rose from 280 in the original measured build (293 after its fixture correction) to 339 here. These changes do not measure library complexity. See the implementation review.
Jdbi required the fewest handwritten lines in this H2 implementation. Supporting multiple database engines can add application code: Jdbi keeps SQL explicit, while jOOQ provides dialect-aware SQL rendering and MyBatis supports selecting vendor-specific statements through databaseIdProvider. For a Jdbi application targeting several engines, I would isolate SQL differences behind small database-specific adapters, with checks against each supported engine. That additional portability work is outside these line counts; its size depends on the queries and database features the application needs.
Qualitatively, Jdbi keeps SQL text, named binding and handle callbacks close together. MyBatis moves SQL and constructor mapping into an annotated interface, giving repository methods a mapper-oriented vocabulary while requiring session and configuration code. jOOQ expresses query composition through compiler-visible schema fields, with the additional generation step and DSL setup. All three still own application-specific transactions, initialization and error handling.
For this application, I selected MyBatis: it had the lowest median workload RSS in both rounds, its HTTP p95 was competitive with Jdbi, and I prefer its annotation-driven mapper model based on prior experience. The first two points come from measurements; the last is a programming-model preference. That choice does not make MyBatis a universal recommendation or diminish Jdbi's competitive latency and explicit SQL model.
App telemetry
StatLite is a lightweight monitoring tool I develop and use for monitoring my Java experiments.
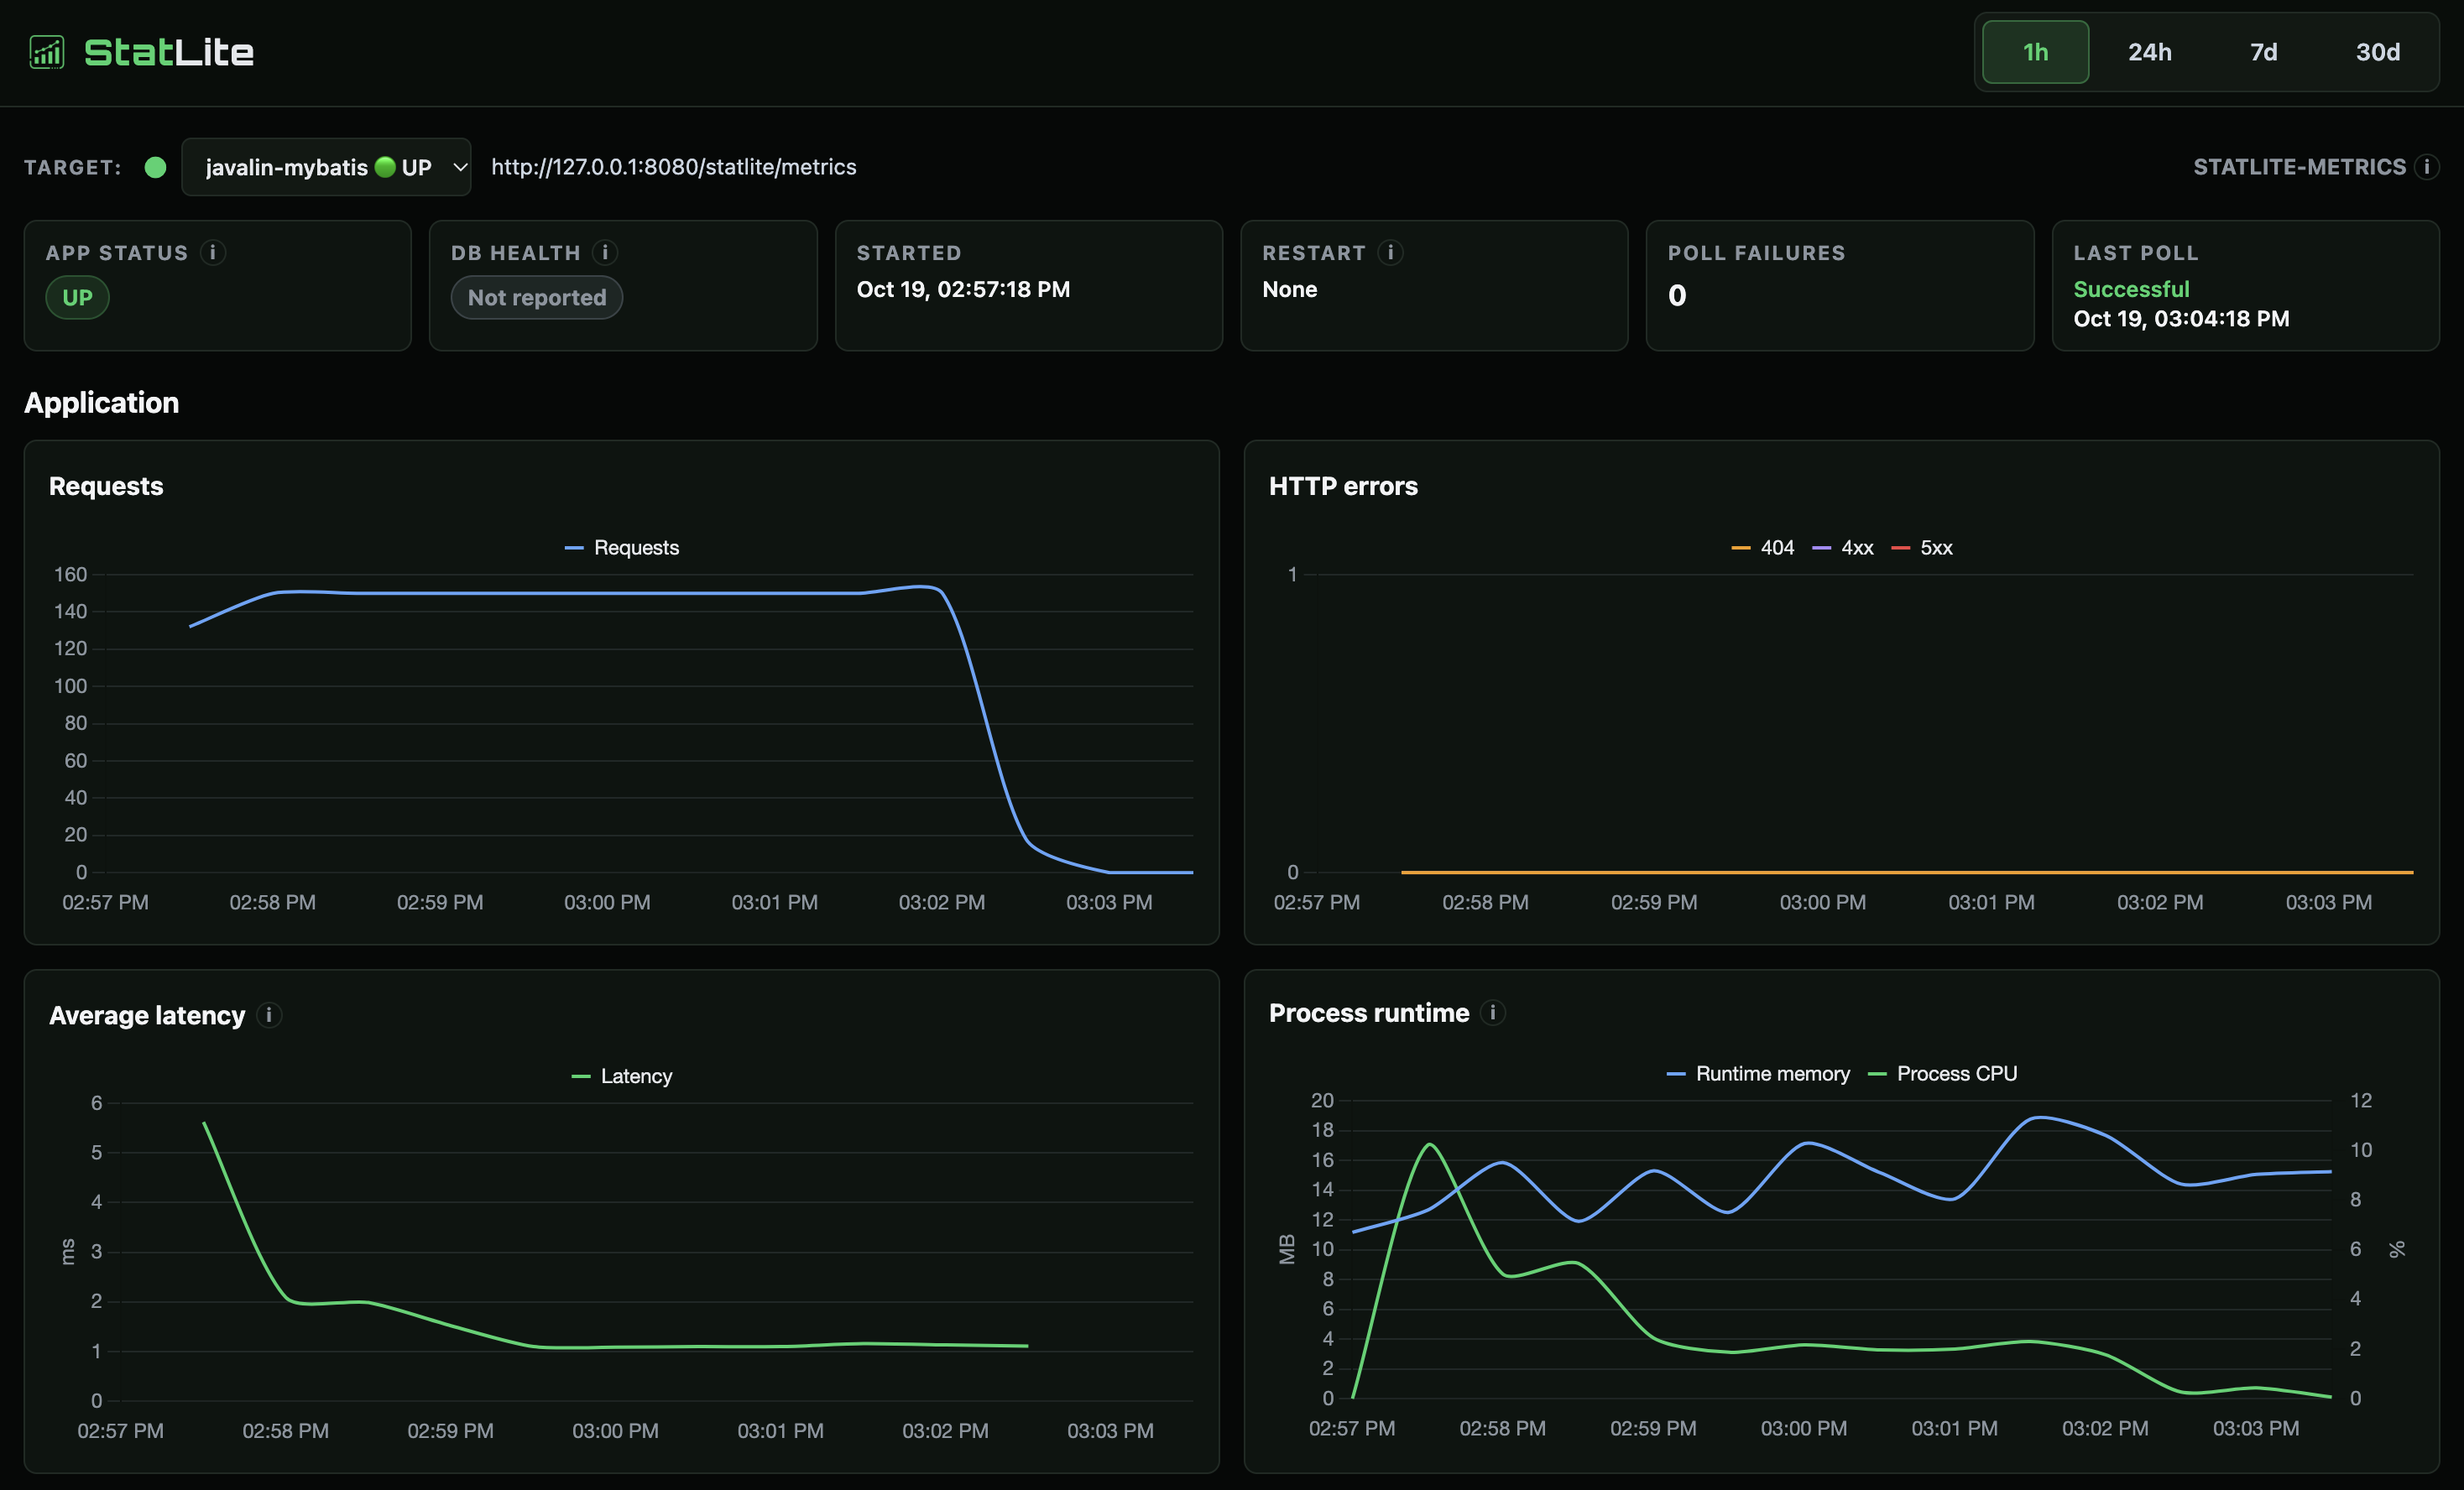
The selected MyBatis build completed one separate repeat with StatLite 0.6.0 polling the application and itself every 30 seconds. It used a rebooted guest, fresh application and monitoring storage, and a 90-second monitor-only baseline before the same application phases. All 1,500 requests completed correctly, with no errors, OOM or swap.
| Measurement | Two runs without StatLite | One run with StatLite |
|---|---|---|
| HTTP p95, ms | 7.47–7.52 | 8.29 |
| Median application RSS, MiB | 116.6–118.0 | 121.4 |
| Minimum workload available memory, MiB | 303.39–303.43 | 292.42 |
| Guest busy CPU, % | 3.55–3.76 | 4.26 |
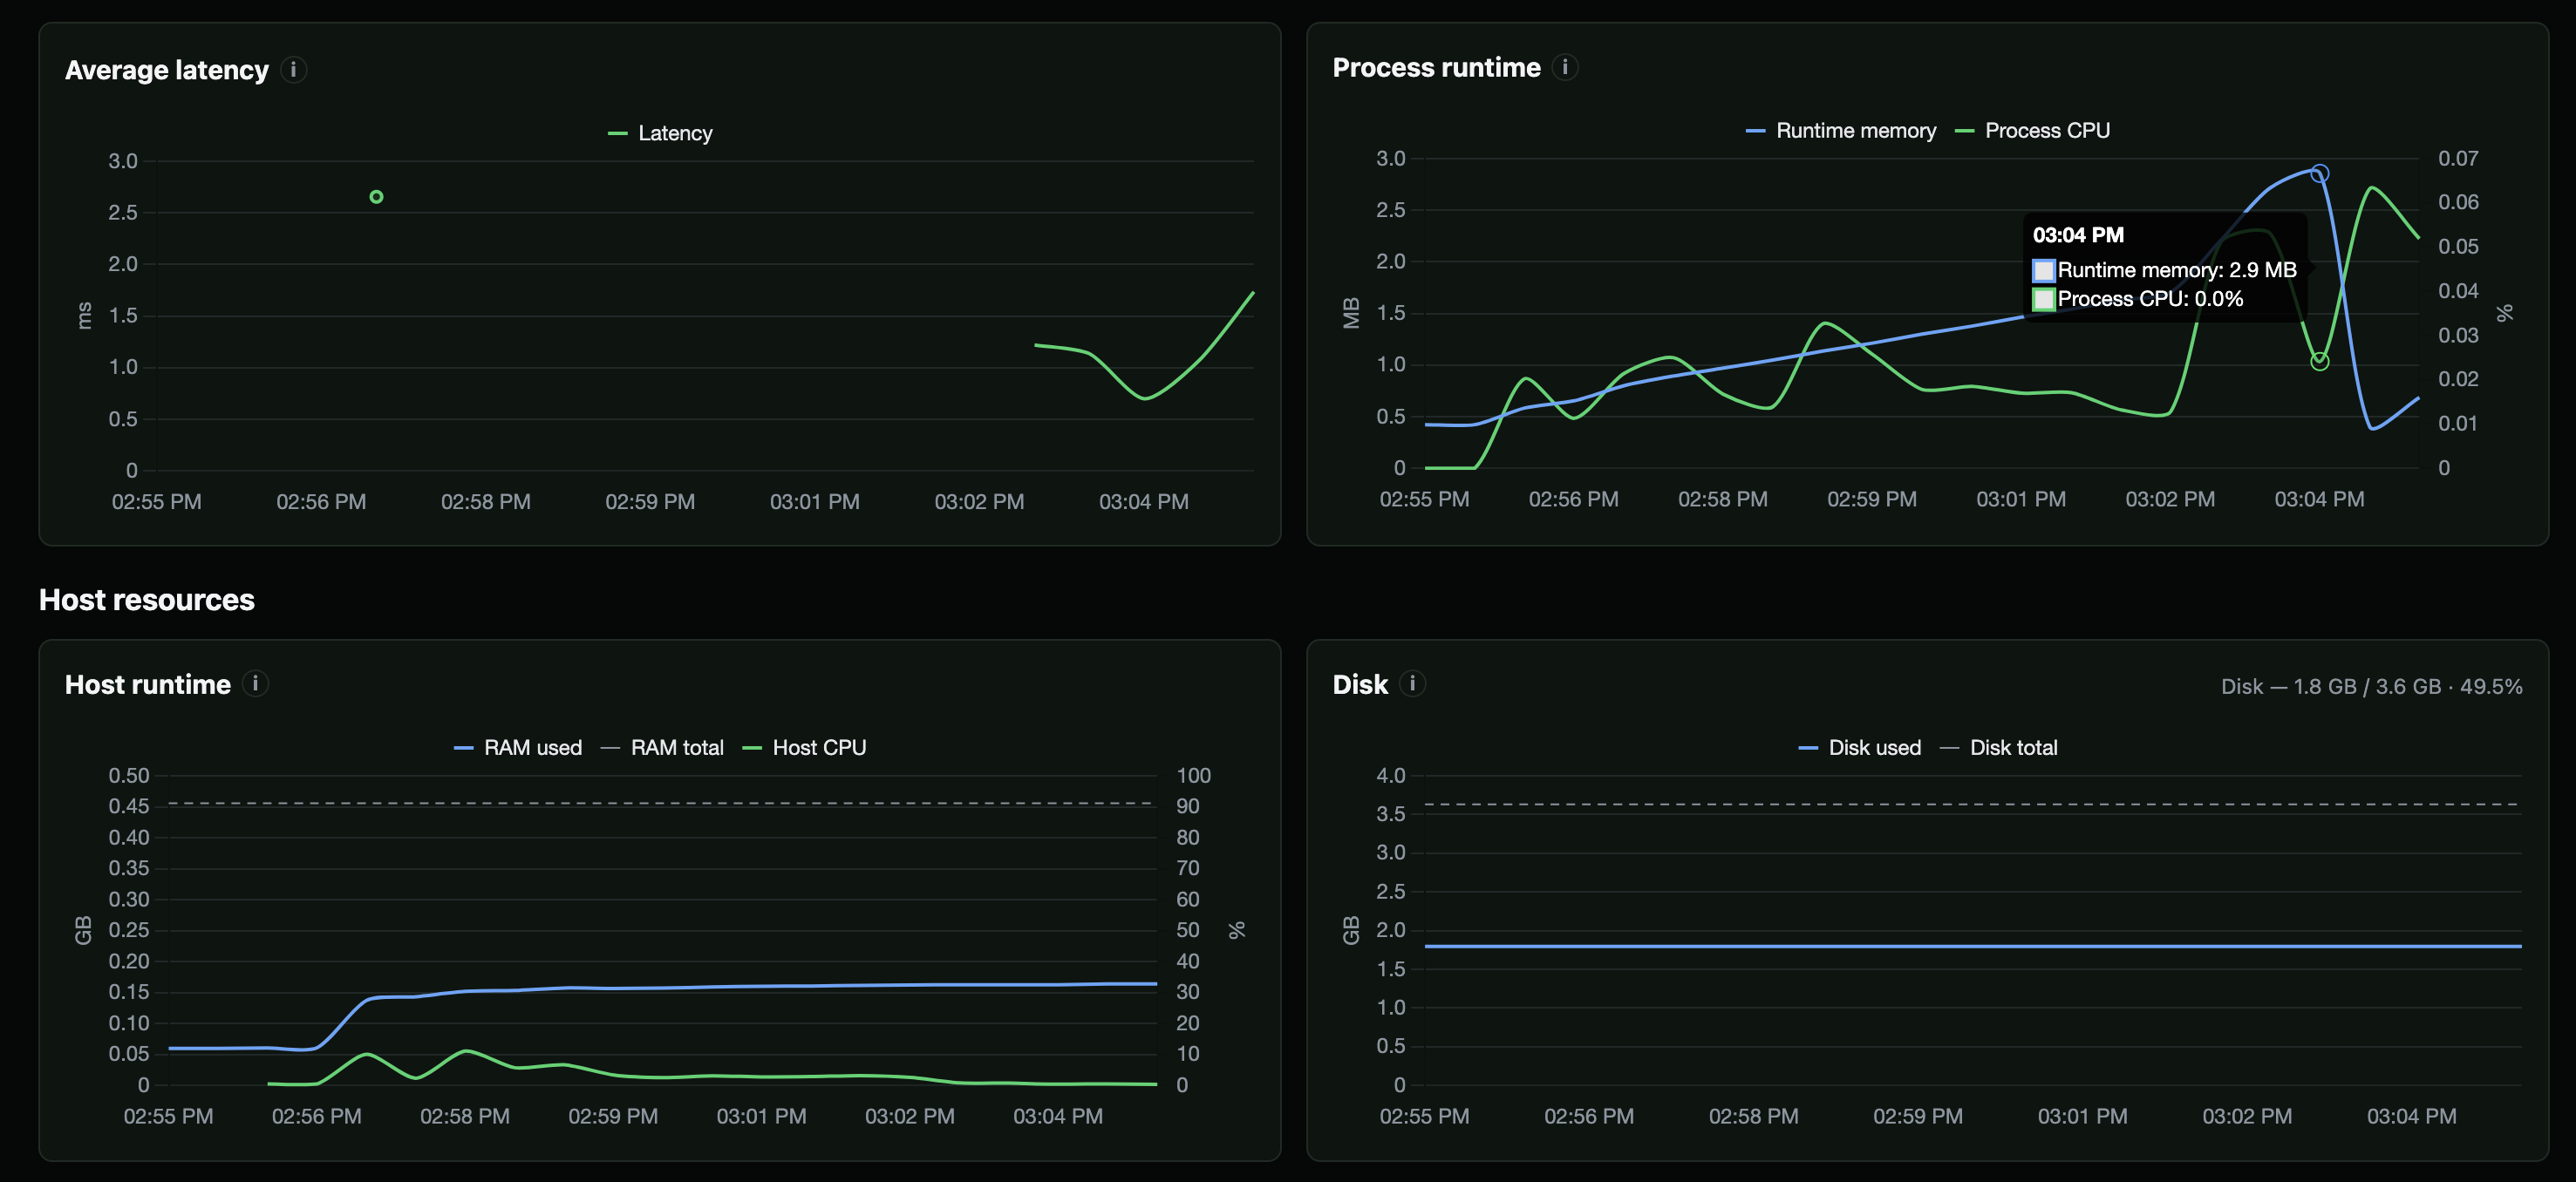
StatLite’s median process RSS was 15.0 MiB during workload, with process CPU around 0.017% of the single vCPU. Application RSS, external p95 and guest CPU were higher in this repeat, but one monitored run cannot separate monitoring effects from ordinary run variation.
What this comparison supports
The repeated 512 MiB results support a practical choice for this small application: MyBatis consistently used the least median workload RSS, Jdbi was competitive on latency, and jOOQ used substantially more resident memory in this configuration. All three completed the workloads correctly with ample available memory and without errors, OOM or swapping.
MyBatis was selected through the combination of measured resource use and a preference for its mapper-oriented programming model. Two short repetitions, one dataset, one JVM policy and an embedded database do not establish a general library winner, production capacity, long-term stability or behavior with a different database.
Sources and reproduction
The public package includes the reviewed application sources, original OS and HTTP samples, measured-build provenance, dependency and code inventories, and the separate monitored MyBatis results.