How metrics move from Express, FastAPI, Django, or Spring Boot into monitoring dashboards, and when you don't need the full stack.
You've deployed a web application. It responds to requests, connects to the database, and appears to be running fine.
But how do you know whether it's getting slower? Whether HTTP 500 errors are increasing? Or whether memory usage has been climbing for the past week?
Search for application monitoring tutorials and you'll quickly encounter Prometheus and Grafana. Many guides tell you how to install both, but it's not always clear what each component actually does or why you might need two additional services to monitor one application.
The key is understanding three separate jobs: producing metrics, collecting and storing them, and making them useful.
How the monitoring pipeline works
The important distinction is that Prometheus pulls metrics from your application, rather than the application continuously sending data to Prometheus.
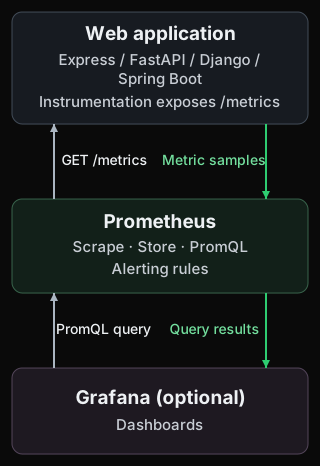
Let's look at each part.
1. Your application produces metrics
Web frameworks handle HTTP requests, but they don't all expose operational metrics automatically.
To monitor an Express application, for example, you typically add middleware or instrumentation that records:
- The number of HTTP requests.
- Response status codes, including 4xx and 5xx errors.
- Request durations.
- Process CPU and memory usage.
A Prometheus instrumentation library can expose these measurements through an HTTP endpoint, usually /metrics.
An illustrative measurement might look like this:
http_requests_total{method="GET",status="500"} 12This means the application has recorded 12 matching requests since the counter began. The metric name and labels depend on the instrumentation library. Express doesn't prescribe them.
The application typically keeps its current counters and gauges in memory. But that alone doesn't give you weeks of history, comparisons across instances, or a convenient way to investigate trends after a process restarts.
That's where Prometheus comes in.
2. Prometheus collects, stores, and queries metrics
Prometheus is an open-source monitoring and alerting system with a built-in time-series database.
You configure it to periodically scrape your application's metrics endpoint, perhaps every 15 seconds.
Each scrape captures the current values. Prometheus stores the measurements with timestamps and labels, allowing you to analyze how they change over time.
For example, if an HTTP request counter increases from 1,000 to 1,060 between two scrapes 15 seconds apart, that works out to an average of four requests per second over that interval, assuming the counter didn't reset.
Its query language, PromQL, lets you do considerably more:
- Calculate request and error rates.
- Compare traffic across application instances.
- Aggregate measurements by status code or route.
- Analyze latency distributions from properly instrumented histograms.
- Detect unusual trends.
Prometheus also evaluates alerting rules written using PromQL. For example, a rule could fire when an application's HTTP 5xx error rate remains above a threshold for several minutes. Alertmanager can handle notification routing and delivery.
Prometheus isn't merely a database. It provides the collection, storage, querying, and rule-evaluation machinery that turns application measurements into useful monitoring data.
It even includes its own web interface for queries and basic graphs.
So why do people install Grafana?
3. Grafana turns metrics into dashboards
Grafana is a separate observability and visualization platform.
In a conventional Prometheus setup, Grafana connects to Prometheus as a data source. It runs queries and presents the results as dashboards.
Instead of manually querying individual metrics, you can build a dashboard showing request rates, error percentages, latency, CPU, and memory together.
Grafana adds reusable panels, dashboard variables, automatic refresh, and the ability to combine information from different data sources. It also has its own alerting capabilities.
Grafana is optional. Prometheus works without it, and Grafana can work with data sources other than Prometheus.
In this architecture, Grafana does not collect metrics directly from your Express application or replace Prometheus's time-series storage. It queries data that Prometheus has already collected.
That's why tutorials frequently install both: Prometheus provides the metrics platform, while Grafana provides a richer dashboard experience.
The pipeline is universal. Instrumentation isn't.
The overall architecture works with almost any web framework. What differs is how your application exposes its metrics.
| Framework | Common instrumentation |
|---|---|
| Express.js | prom-client or Express metrics middleware |
| FastAPI | prometheus-fastapi-instrumentator |
| Django | django-prometheus |
| Spring Boot | Micrometer + Actuator |
Spring Boot has a more established metrics integration. Actuator and Micrometer provide common instrumentation conventions, including HTTP requests, JVM memory, and process metrics. With the Prometheus registry dependency and endpoint exposure configured, Spring Boot can publish metrics through /actuator/prometheus.
Express, FastAPI, and Django generally rely on additional libraries or middleware. Different libraries may produce different metric names and labels, even when they use the same Prometheus exposition format.
That distinction matters. Prometheus standardizes how metrics are collected and queried, but it doesn't guarantee that every framework exposes the same application measurements.
Regardless of the framework, the essential pipeline remains the same: instrument the application, collect measurements, store their history, and visualize the results.
When Prometheus and Grafana are worth the complexity
There's a reason Prometheus and Grafana are so widely used. They solve problems that become increasingly important as applications grow.
Imagine monitoring 20 services, multiple database instances, background workers, and dynamically created containers.
You may need to combine measurements across instances, filter them by labels, build custom business metrics, investigate p95 and p99 response times, and configure sophisticated alerting rules.
Prometheus is particularly strong in these situations. PromQL gives you a flexible way to analyze metrics without being limited to a predefined dashboard.
Grafana adds a convenient interface for exploring and sharing that information across a team.
But that flexibility introduces operational responsibilities.
A self-hosted Prometheus deployment needs scrape configuration, storage, retention settings, upgrades, and secured access to its endpoints. Adding Grafana means another service to configure, maintain, and secure, along with its dashboards and data-source connections.
These services can run on the same host as your application. Prometheus itself is a standalone binary, and neither Kubernetes nor Grafana is required.
The software is free, and a small Prometheus deployment can be perfectly reasonable. Managed monitoring services can also reduce the operational burden.
The real question is whether the additional capabilities justify the configuration, resources, and maintenance for your particular application.
For many teams, they do. For one small application, they may not.
What if you just want to monitor a small app on a VPS?
Suppose you're running a single Express, FastAPI, Django, or Spring Boot application on a VPS with 512 MB or 1 GB of RAM.
You probably don't need arbitrary custom metrics or a sophisticated query language just to answer:
- Is my application healthy?
- How many requests is it receiving?
- Are HTTP errors increasing?
- Is average response latency getting worse?
- Is CPU or memory usage climbing?
You need instrumentation, historical measurements, and charts. But you don't necessarily need a general-purpose metrics platform.
A smaller monitoring setup with StatLite
StatLite is an open-source monitoring tool I developed at PVR Labs. It's designed for small applications and VPS deployments. One lightweight Go binary collects measurements from applications, stores their history in SQLite, and provides built-in dashboards. Measured idle memory usage is approximately 15 MiB in small-server configurations.
For Express, FastAPI, and Django, StatLite provides integration helpers using a fixed JSON metrics profile. For Spring Boot, it can use Actuator and Micrometer metrics directly.
StatLite focuses on request counts, HTTP errors, average latency, and runtime resource measurements, with optional application health and host monitoring where supported.
The tradeoff is deliberate: it doesn't support arbitrary custom metrics, PromQL, or histogram-based latency percentiles. Alerting can be implemented using its read-only API and automation recipes rather than built-in alert rules.
If you need those advanced capabilities, Prometheus may be the better choice.
But if you're running a small application and mostly want to see whether it's working, how it's performing, and what has changed, a simpler monitoring setup can be enough.
Integration guides
For practical setup instructions, see:
- Express.js monitoring without Prometheus and Grafana (complete Node.js integration and runnable example).
- Monitoring a FastAPI app on a small VPS (lightweight Python integration).
- Django monitoring (Django middleware and metrics endpoint).
- Spring Boot monitoring (using Actuator metrics with StatLite).
The bottom line
Application monitoring has several responsibilities: measuring what's happening, collecting and storing the measurements, and presenting them in a useful form.
Prometheus handles collection, time-series storage, queries, and alerting rules. Grafana adds richer dashboards and visualization. Your application provides the measurements through instrumentation.
These are separate responsibilities, which is why the tools are separate.
If you need flexible metrics, powerful queries, and monitoring across many services, Prometheus and Grafana are excellent choices.
If you only need a few essential metrics for a small application, you can choose a simpler setup that combines collection, storage, and dashboards.
The goal isn't to run fewer tools at any cost. It's to have enough visibility to understand your application without operating more monitoring infrastructure than you need.